CRU ToughTech Duo C Storage Enclosure (2x 2.5" to USB 3.1 Gen 2 Type-C) Review
by Ganesh T S on November 18, 2016 8:00 AM ESTPerformance Benchmarks
Our evaluation routine for storage bridges borrows heavily from the testing methodology for direct-attached storage devices. The testbed hardware is reused. CrystalDiskMark is used for a quick overview, as it helps determine availability of UASP support and provides some performance numbers under ideal scenarios. Real-world performance testing is done with our custom test suite involving robocopy bencharks and PCMark 8's storage bench.
CrystalDiskMark uses four different access traces for reads and writes over a configurable region size. Two of the traces are sequential accesses, while two are 4K rando accesses. Internally, CrystalDiskMark uses the Microsoft DiskSpd storage testing tool. The 'Seq Q32T1' sequential traces use 128K block size with a queue depth of 32 from a single thread, while the '4K Q32T1' ones do random 4K accesses with the same queue and thread configurations. The plain 'Seq' traces use a 1MiB block size. The plain '4K' ones are similar to the '4K Q32T1' except that only a single queue and single thread are used.
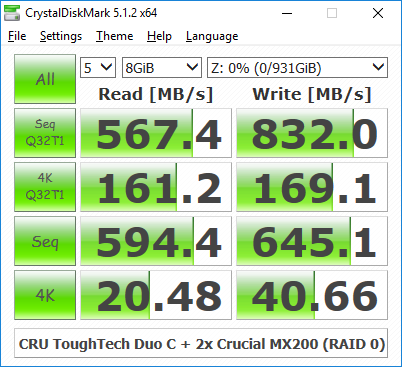
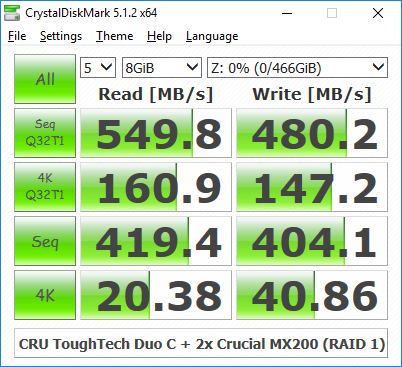
Comparing the '4K Q32T1' and '4K' numbers can quickly tell us whether the storage device supports NCQ (native command queuing) / UASP (USB-attached SCSI protocol). If the numbers for the two access traces are in the same ballpark, NCQ / UASP is not supported. This assumes that the host port / drivers on the PC support UASP. We can see that the ASM1352R bridge chip has no issues supporting UASP. The RAID 1 benchmark numbers are quite close to what one might expect with a direct SATA connection for the SSD. RAID 0 numbers are obviously better for the sequential accesses. All these tests were done with two Crucial MX200 500GB SSDs configured in the appropriate RAID mode.
| Storage Bridge Benchmarks - CrystalDiskMark | ||
 |
 |
|
Moving on to the real-world benchmarks, we first look at the results from our custom robocopy test. In this test, we transfer three folders with the following characteristics.
- Photos: 15.6 GB collection of 4320 photos (RAW as well as JPEGs) in 61 sub-folders
- Videos: 16.1 GB collection of 244 videos (MP4 as well as MOVs) in 6 sub-folders
- BR: 10.7 GB Blu-ray folder structure of the IDT Benchmark Blu-ray (the same that we use in our robocopy tests for NAS systems)
The test starts off with the Photos folder in a RAM drive in the testbed. robocopy is used with default arguments to mirror it onto the storage drive under test. The content on the RAM drive is then deleted. robocopy is again used to transfer the content, but, from the storage drive under test to the RAM drive. The first segment gives the write speed, while the second one gives the read speed for the storage device. The segments end with the purge of the contents from the storage device. This process is repeated thrice and the average of all the runs is recorded as the performance number. The same procedure is adopted for the Videos and the BR folders. Readers interested in looking at all the graphs in one shot can choose the 'Expand All' option in the dropdown menu.
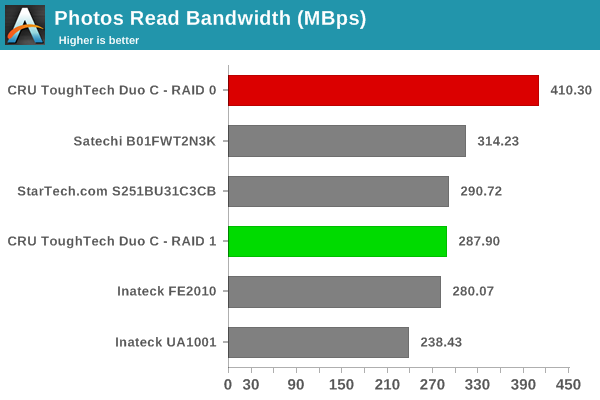
The numbers show the obvious - given the sequential nature of the operations, the RAID 0 configuration wins the benchmark numbers hands down. In the RAID 1 mode, the performance is similar to that of the other USB 3.1 Gen 2 storage bridges that we have evaluated before.
High-performance external storage devices can also be used for editing multimedia files directly off the unit. They can also be used as OS-to-go boot drives. Evaluation of this aspect is done using PCMark 8's storage bench. The storage workload involves games as well as multimedia editing applications. The command line version allows us to cherry-pick storage traces to run on a target drive. We chose the following traces.
- Adobe Photoshop (Light)
- Adobe Photoshop (Heavy)
- Adobe After Effects
- Adobe Illustrator
Usually, PC Mark 8 reports time to complete the trace, but the detailed log report has the read and write bandwidth figures which we present in our performance tables. Note that the bandwidth number reported in the results don't involve idle time compression. Results might appear low, but that is part of the workload characteristic. Note that the same CPU is being used for all configurations. Therefore, comparing the numbers for each trace should be possible across different DAS units. Readers interested in looking at all the graphs in one shot can choose the 'Expand All' option in the dropdown menu.
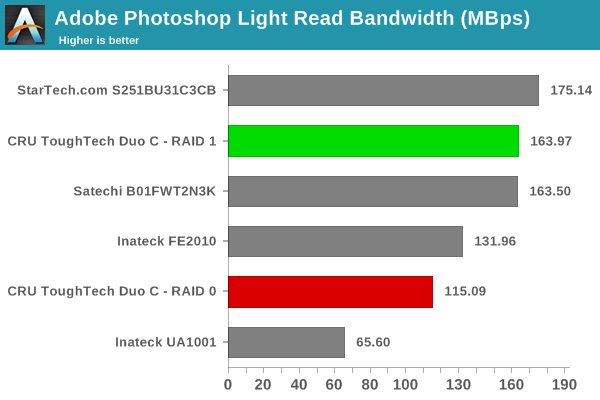
The real-world benchmark numbers show that editing operations do not always benefit from the RAID 0 mode.


25 Comments
View All Comments
jb14 - Friday, November 18, 2016 - link
Jog on iranterresiranterres - Friday, November 18, 2016 - link
Too bad if you like to insult people with opposite opinions.Tony Merryfield - Friday, November 18, 2016 - link
Too bad you think everything has to revolve around your needs and interests.iranterres - Friday, November 18, 2016 - link
Even worse when you have assumptions you're not aware of.close - Saturday, November 19, 2016 - link
Then what exactly are you basing your statement that "Anandtech is in a wave of uninteresting reviews...sadly."?Have you conducted a survey among some or most readers? Have you found some markers that objectively prove that the reviews are "uninteresting"? Or were you just basing that solely on your personal opinions and preferences that you then generalized in your misplaced belief that they are relevant and matter to others?
I actually don't expect an *good* answer. Reader quality has also gone down around here ;).
irusun - Saturday, November 19, 2016 - link
I think it's an interesting article and this seemed like a really weird article to unleash the "Anandtech is going downhill" comment (I'm paraphrasing).However, that aside, I've been visiting this site weekly for over 15 years, and its obviously changed a great deal over that time. An argument could be made that the quality has plummeted in recent years, which in turn drove away much of the long-time audience (or they at least became much less active readers/commenters), and in turn, they're left with a very, ahem, specific audience. In other words, audiences change based on the content, so maybe there's a correlation between reader quality and the quality of the site.
I've been reading Ars for just as long, and that site has completely remade itself into a tech version of the Huffington Post... they've attracted a huge audience, but it's largely an unrecognizable audience to the way it was 10 years ago.
p.s. no ill feelings towards the staff of Anandtech, and for certain technical areas, Anandtech still can't be beat. Keep up the good work as best you can!
iranterres - Monday, November 21, 2016 - link
People are getting used to be so sensitive about facing opposite opinions, oh geez.I have never questioned the usefulness of the article, but the quality of the recent ones is bad. Looks rushed and some copy and paste galore. That's MY opinion like it or not as I do respect others and don't go bitching around about it.
Maybe next time we need some thermal paste reviews...
Tony Merryfield - Friday, November 18, 2016 - link
Interestingly, all the revcontent content is about revcontent. Laughable, and in itself a terrible advert for the company.irusun - Saturday, November 19, 2016 - link
I can't get over the utter stupidity of the USB forum creating completely unnecessary confusion with USB 3.1 Gen 1 and USB 3.1 Gen 2 naming conventions. Was USB 3.2 already taken? USB 4? Really, you know that they're were a bunch of guys at that meeting who were just laughing their asses off at the anticipated consumer confusion it was going to cause - I guarantee you they thought it was hilarious.close - Saturday, November 19, 2016 - link
Initially there was no confusion. You had USB 3.0 since 2008 and USB 3.1 since 2013. Then someone decided it's a good idea to lend a hand to manufacturers that really had to market their sagging old products as having brand new features... by just changing a few characters on a specsheet.Manufacturers just "convinced" USB-IF that they should just be allowed to use the same USB 3.0 controllers but call them USB 3.1 thus tricking most users, increasing sales and cutting costs based on what could only be called a lie.
The specs for 3.0 and 3.1 are pretty similar, certainly nothing on the difference between 2.0 and 3.0 so calling them 3.0 and 3.1 made perfect sense - tiny version increment.
Don't forget that the USB-IF is a non profit organisation so money must be made somehow... You can thank the following people/companies for this:
HP Inc. - Alan Berkema
Intel Corporation - Brad Saunders
Microsoft Corporation - Toby Nixon
Renesas Electronics - Philip Leung
STMicroelectronics - Joel Huloux