The Mainstream Phoenix Rises: Samsung's 970 EVO (500GB & 1TB) SSDs Reviewed
by Billy Tallis on April 24, 2018 10:00 AM ESTRandom Read Performance
Our first test of random read performance uses very short bursts of operations issued one at a time with no queuing. The drives are given enough idle time between bursts to yield an overall duty cycle of 20%, so thermal throttling is impossible. Each burst consists of a total of 32MB of 4kB random reads, from a 16GB span of the disk. The total data read is 1GB.
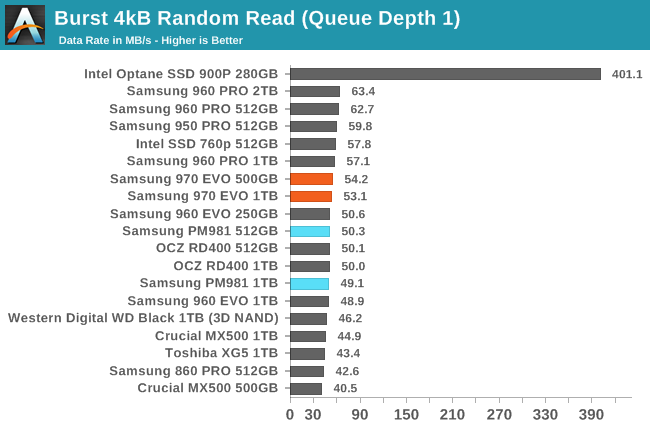
The burst random read performance of the Samsung 970 EVO is the best they've ever delivered from TLC NAND flash memory, but the Intel SSD 760p is a few percent faster still.
Our sustained random read performance is similar to the random read test from our 2015 test suite: queue depths from 1 to 32 are tested, and the average performance and power efficiency across QD1, QD2 and QD4 are reported as the primary scores. Each queue depth is tested for one minute or 32GB of data transferred, whichever is shorter. After each queue depth is tested, the drive is given up to one minute to cool off so that the higher queue depths are unlikely to be affected by accumulated heat build-up. The individual read operations are again 4kB, and cover a 64GB span of the drive.
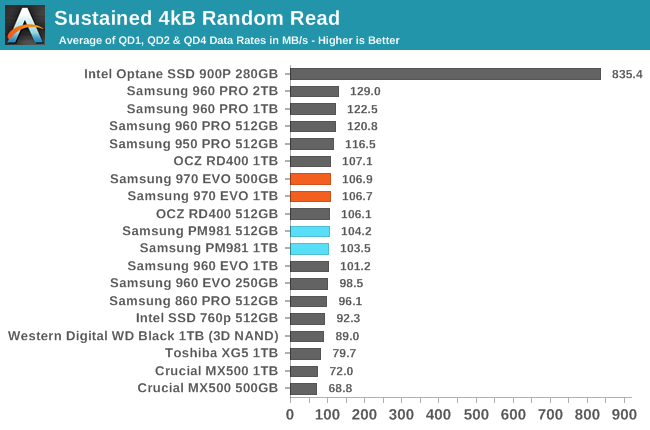
On the longer random read test, the Samsung 970 EVO proves to be the fastest TLC-based drive, but Samsung's MLC-based drives offer up to 20% higher performance.
 |
|||||||||
| Power Efficiency in MB/s/W | Average Power in W | ||||||||
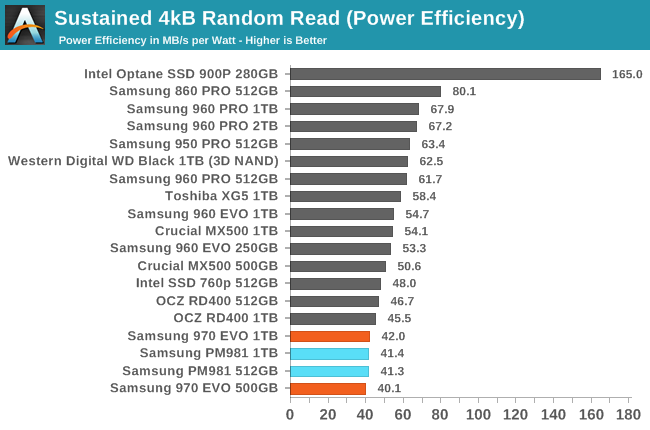
The Samsung 970 EVO and its OEM sibling PM981 have the worst power efficiency of any recent high-end SSD during the random read test. The 970 EVO is drawing over 2.5W while Samsung's previous generation high end drives averaged less than 2W for very similar performance.
 |
|||||||||
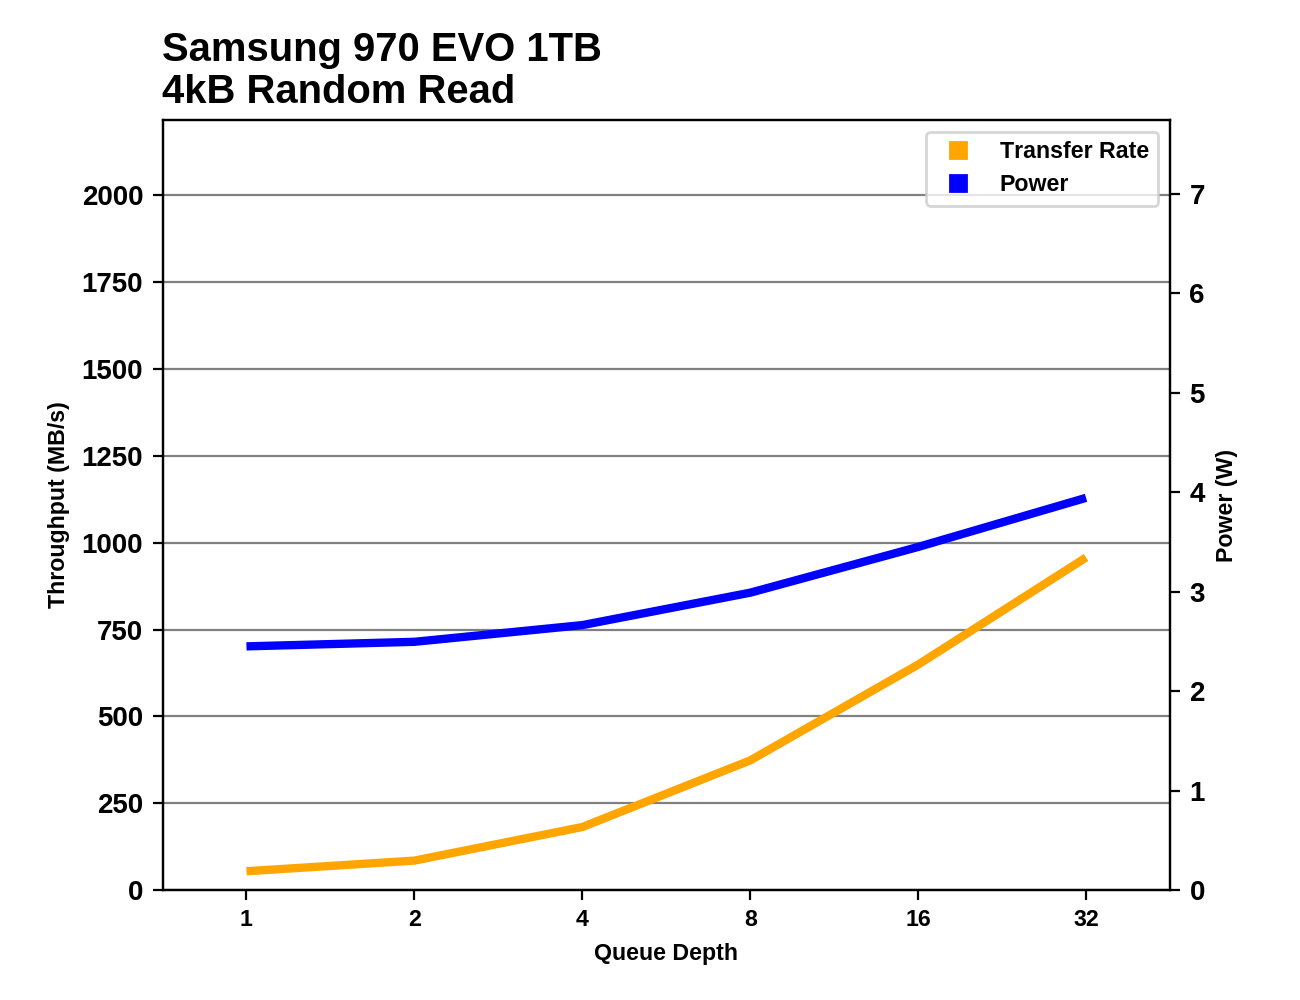
The performance scaling of the 970 EVO is almost identical to that of the 960 EVO, but the 970 EVO draws more power throughout the random read test.
Random Write Performance
Our test of random write burst performance is structured similarly to the random read burst test, but each burst is only 4MB and the total test length is 128MB. The 4kB random write operations are distributed over a 16GB span of the drive, and the operations are issued one at a time with no queuing.
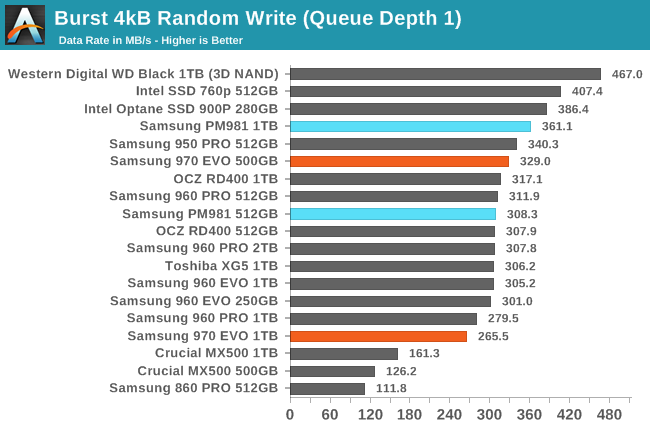
The burst random write performance from the Samsung 970 EVO is disappointing compared to the PM981, especially for the 1TB 970 EVO. Meanwhile, recent Intel and WD drives have been raising the bar with very fast SLC write caches.
As with the sustained random read test, our sustained 4kB random write test runs for up to one minute or 32GB per queue depth, covering a 64GB span of the drive and giving the drive up to 1 minute of idle time between queue depths to allow for write caches to be flushed and for the drive to cool down.
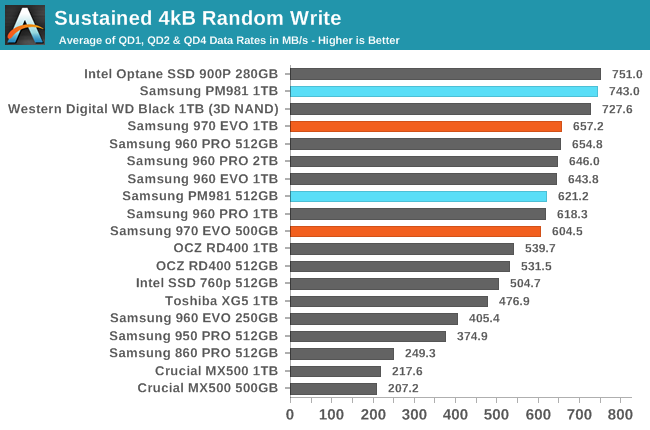
On the longer random write test, the 1TB PM981 provided top-tier performance, but the 1TB 970 EVO is about 12% slower, putting it on par with the previous generation from Samsung. The 500GB 970 EVO is also slightly slower than its PM981 counterpart.
 |
|||||||||
| Power Efficiency in MB/s/W | Average Power in W | ||||||||
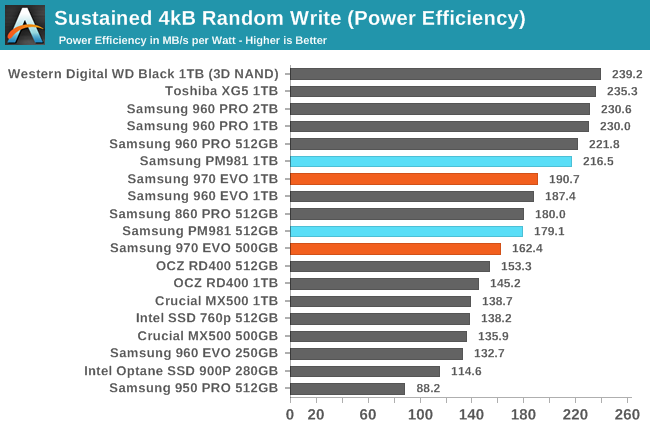
Power efficiency has also regressed for the 970 EVO on the random write test, leaving it well below the standard set by the WD Black and the slower but similarly efficient Toshiba XG5.
 |
|||||||||
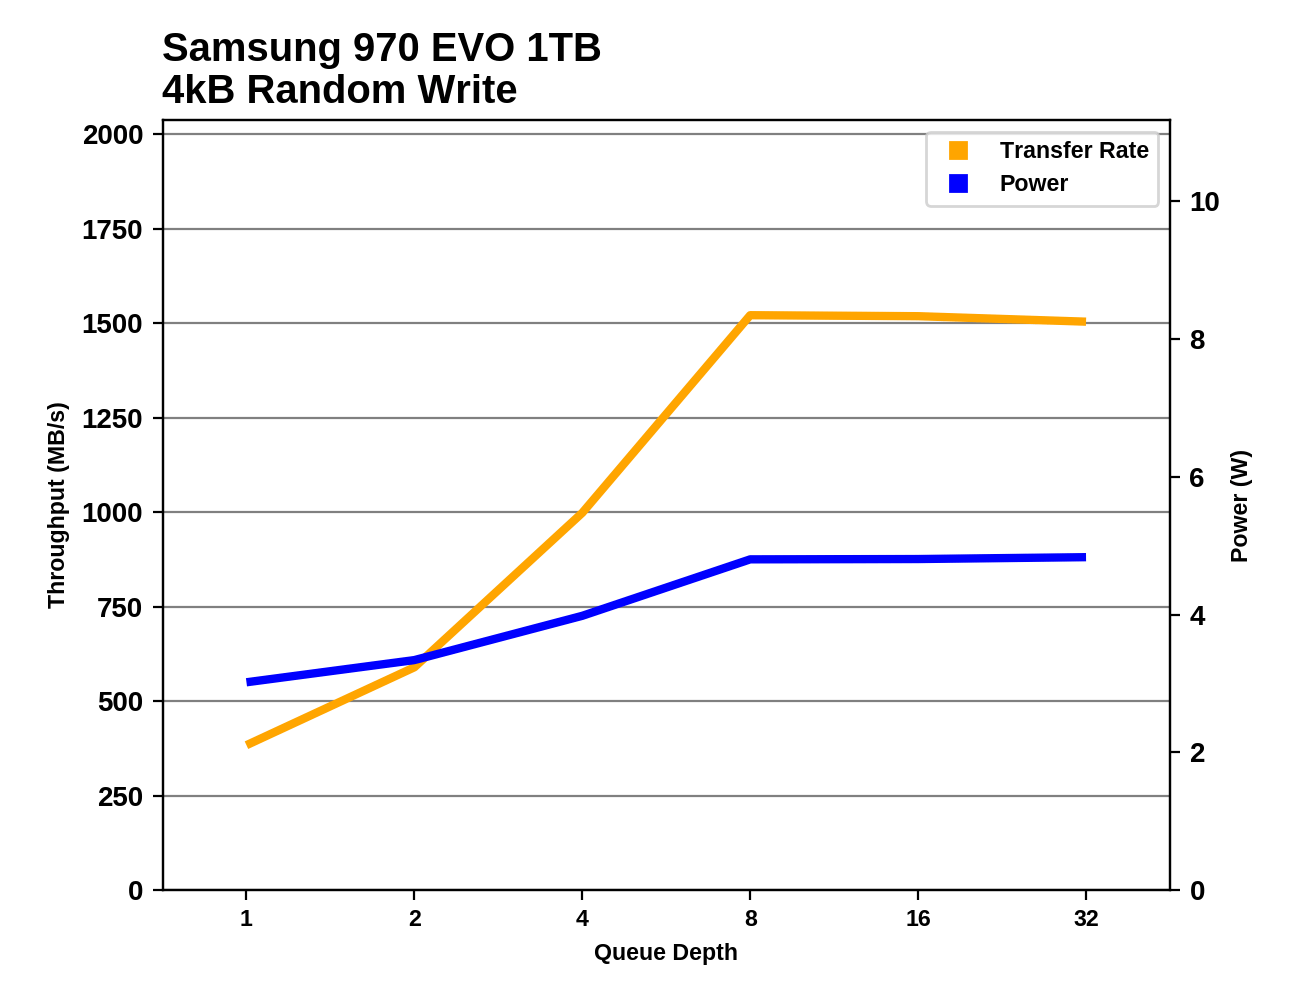
The random write performance of the 1TB 970 EVO tops out at just over 1.5 GB/s at queue depths of 8 and higher. The 500GB 970 EVO starts running out of SLC cache and showing inconsistent performance past QD4. The 1TB PM981 was able to ramp up performance much faster than the 970 EVO and hit a maximum of about 1.8GB/s before running out of SLC cache near the end of the test. The 512GB PM981 behaved very similarly to the 500GB 970 EVO.


68 Comments
View All Comments
bji - Tuesday, April 24, 2018 - link
You're kind of arguing against benchmarking in general here. Almost no benchmarks are directly relevant to any one person's intended use of the product. Benchmarks are not useful in that they tell me exactly how much performance to expect when running one specific program on one specifically configured hardware setup. They are useful because they allow extrapolation from measured results to expected results on workloads that actually matter to the reader.So I don't agree with your sentiment that Meltdown/Spectre are not worth consideration for their effect on system performance.
However, I am not sure that I would include Meltdown/Spectre considerations in a specific SSD review. I think these considerations deserve to be in a CPU review.
bji - Tuesday, April 24, 2018 - link
Also, may I say that users generally will not notice a 5% slowdown in any particular task; however, we've already established that readers care about minimum differences in benchmark results, because they routinely call a 5% difference clear indication of a "winner" and a "loser" for that benchmark, so for the purposes of performance reviews, the 5% difference contributed by Meltdown/Spectre definitely matters.Flying Aardvark - Tuesday, April 24, 2018 - link
It's up to 50% reduction in storage performance not 5%. You'll feel 50% loss when it happens to you.cmdrdredd - Tuesday, April 24, 2018 - link
What you are saying is misleading. SATA performance is nearly identical (within 2% difference for me). It's NVMe drives that take the hit, but even still they are faster than everything else. Processor speed is unaffected for me as well. Tested multiple times with various benchmarks both ways and it was within margin of error. I don't see the problem to be honest.LurkingSince97 - Wednesday, April 25, 2018 - link
Tell that to my I/O intensive servers that suddenly have 30% less throughput.modeonoff - Tuesday, April 24, 2018 - link
Yes but I am not an average customer. Performance is important for me.Ryun - Tuesday, April 24, 2018 - link
For everyday tasks do you guys notice an improvement in responsiveness of NVMe SSDs versus SATA SSDs?The transfer rates are definitely impressive, I've just never seen a review where I've wanted to upgrade my 500GB SATA SSD for development/gaming/maintenance tasks on my machine. Seems like boot times and opening programs are within a couple seconds of another between NVMe and SATA. Nothing like the jump between HDDs vs SSDs.
HollyDOL - Tuesday, April 24, 2018 - link
I wonder myself, got Vertex 3 (240GB) and while not permanently watching perf counters I don't see much cases of 100% load. Wonder if I would be able to see a difference if I moved to some "best enthusiast m.2/pcie ssd available". (Rest of the machine is fully capable)eek2121 - Tuesday, April 24, 2018 - link
I notice it in certain tasks. My system can get from cold boot to the login screen in about 3 seconds for instance. Editing video is much faster as well.imaheadcase - Tuesday, April 24, 2018 - link
I wouldnt say a huge performance, it really depends on certain tasks that you work with. If you work with file manager a lot with big files sure. But most people no. It makes sense if just upgrading though.