The SK Hynix Gold S31 SATA SSD Review: Hynix 3D NAND Finally Shows Up
by Billy Tallis on November 13, 2019 12:00 PM ESTSequential Read Performance
Our first test of sequential read performance uses short bursts of 128MB, issued as 128kB operations with no queuing. The test averages performance across eight bursts for a total of 1GB of data transferred from a drive containing 16GB of data. Between each burst the drive is given enough idle time to keep the overall duty cycle at 20%.
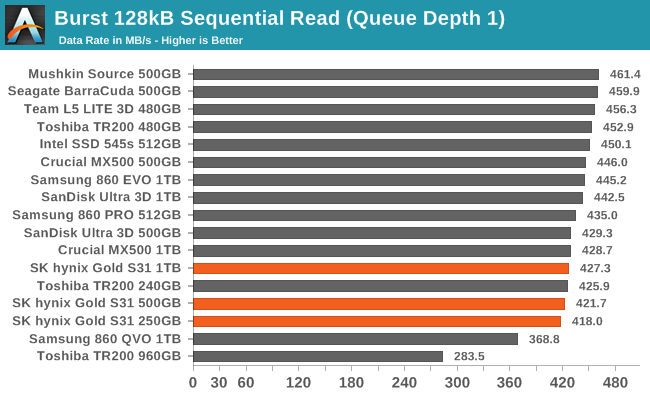
The burst sequential read performance of all three capacities of the SK Hynix Gold S31 are a bit on the slow side, but from the smallest and slowest S31 up to the fastest SATA drive in this batch is a mere 10%.
Our test of sustained sequential reads uses queue depths from 1 to 32, with the performance and power scores computed as the average of QD1, QD2 and QD4. Each queue depth is tested for up to one minute or 32GB transferred, from a drive containing 64GB of data. This test is run twice: once with the drive prepared by sequentially writing the test data, and again after the random write test has mixed things up, causing fragmentation inside the SSD that isn't visible to the OS. These two scores represent the two extremes of how the drive would perform under real-world usage, where wear leveling and modifications to some existing data will create some internal fragmentation that degrades performance, but usually not to the extent shown here.
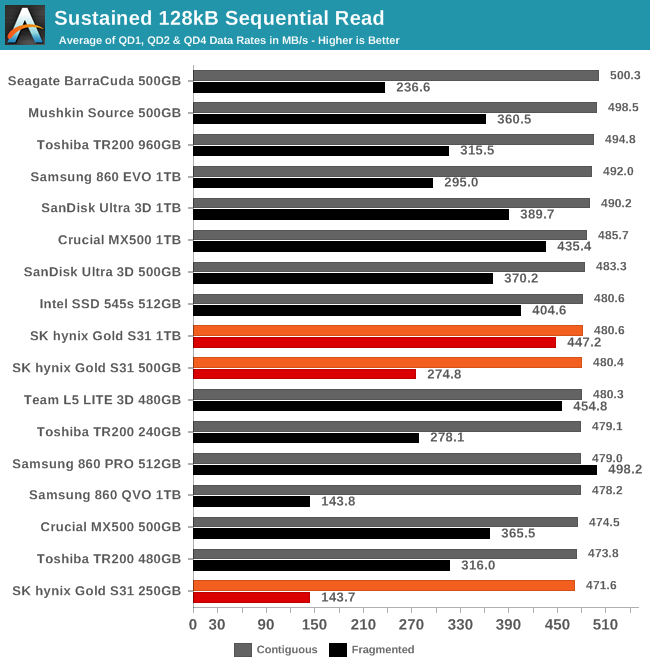
On the longer sequential read test that brings in some moderately higher queue depths, all the SATA drives perform similarly for reading data that was written sequentially. When performing sequential reads of data that was written randomly, the 1TB S31 performs quite well but the smaller models suffer significantly.
 |
|||||||||
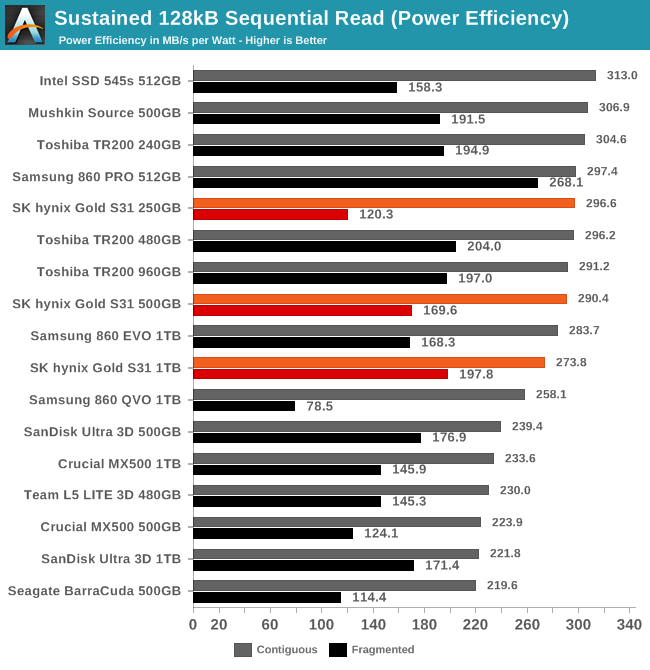
| Power Efficiency in MB/s/W | Average Power in W | ||||||||
The power efficiency of the S31 doesn't stand out on the sequential read test. It doesn't consume much less power than the competition, and with the performance scores showing little variation across the entire field, the efficiency scores for the S31 are good but nothing special.
 |
|||||||||
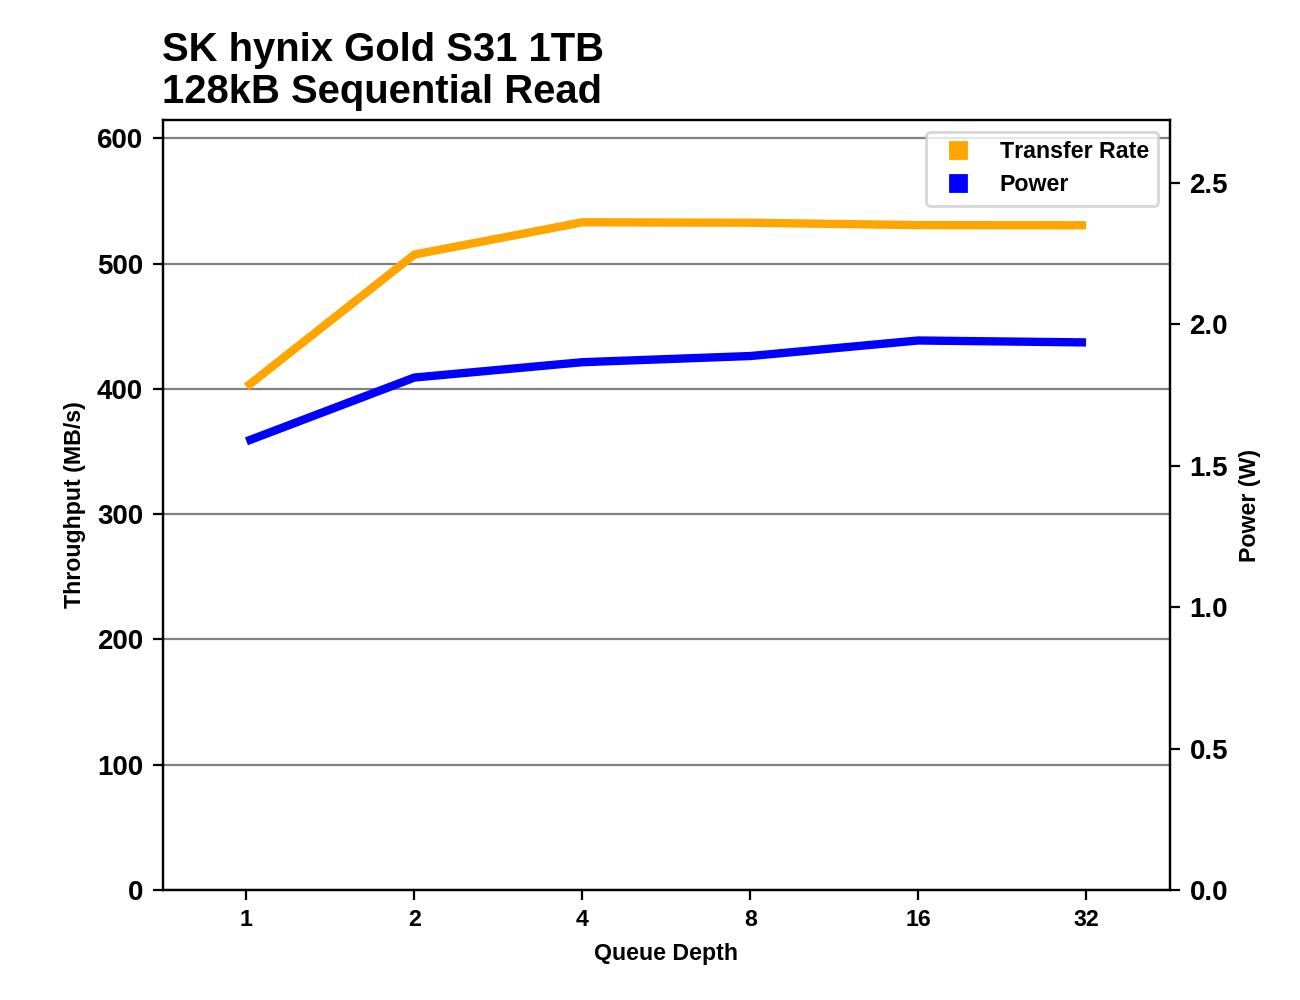
The S31 drives don't quite reach full sequential read speed until QD4. The larger two models perform identically across the entire range of queue depths, with the 1TB model consistently drawing a bit more power than the 500GB model. The 250GB model has a slight performance blip or two but otherwise it also matches the performance of the other two drives.
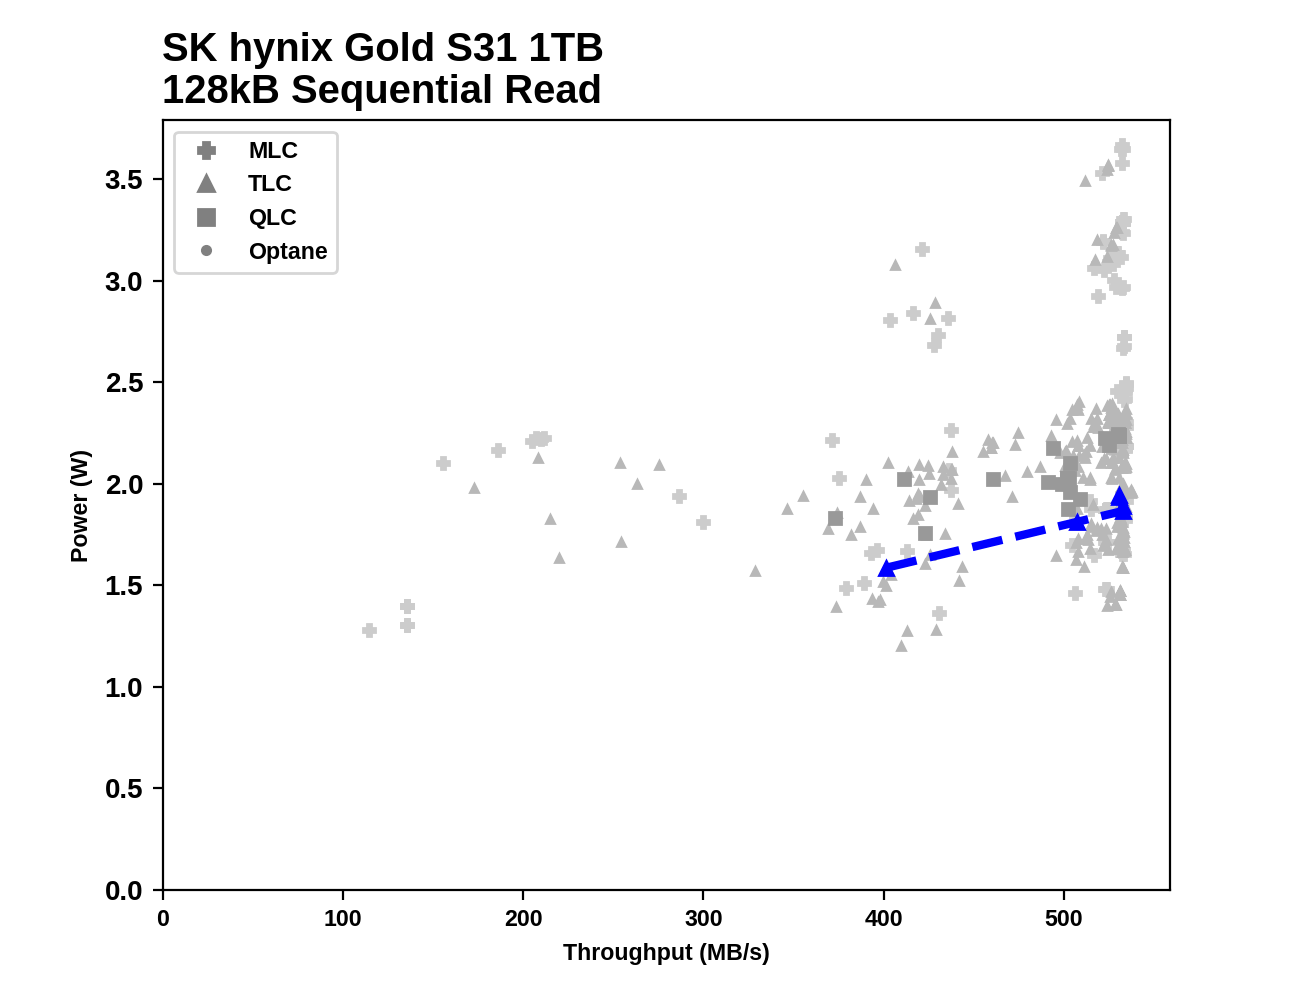
The power usage of the 1TB S31 during the sequential read test is a bit less than average, but unlike for the random IO tests it isn't standing at the limits of what is currently achievable
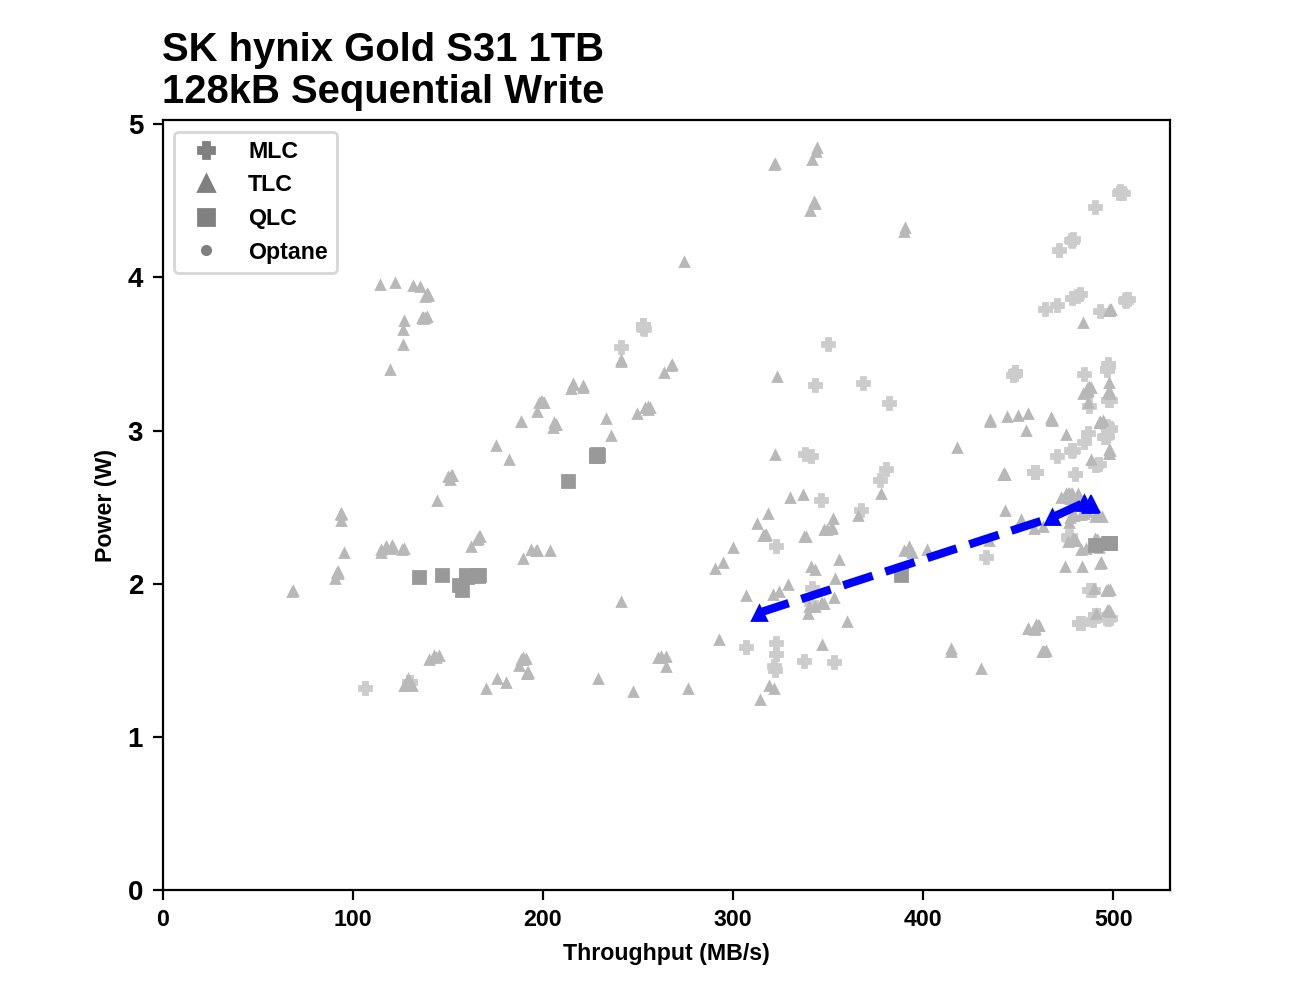
Sequential Write Performance
Our test of sequential write burst performance is structured identically to the sequential read burst performance test save for the direction of the data transfer. Each burst writes 128MB as 128kB operations issued at QD1, for a total of 1GB of data written to a drive containing 16GB of data.
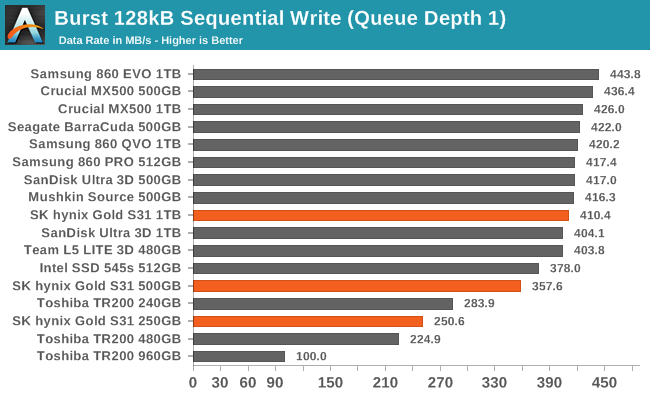
On the burst sequential write test, the 1TB SK Hynix Gold S31 turns in a decent score. The 500GB model is a little bit slower, and the 250GB S31 manages to be a bit slower than the DRAMless Toshiba TR200.
Our test of sustained sequential writes is structured identically to our sustained sequential read test, save for the direction of the data transfers. Queue depths range from 1 to 32 and each queue depth is tested for up to one minute or 32GB, followed by up to one minute of idle time for the drive to cool off and perform garbage collection. The test is confined to a 64GB span of the drive.
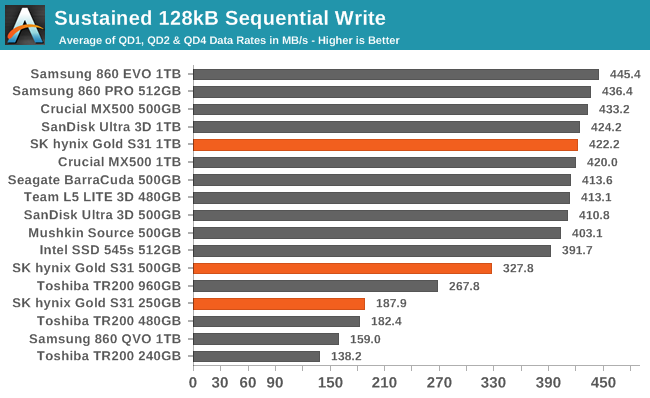
On the longer sequential write test, the 1TB S31 improves its standing to keep up with its like-sized competition while the 500GB model clearly falls behind.
 |
|||||||||
| Power Efficiency in MB/s/W | Average Power in W | ||||||||
The larger two capacities of the S31 earn decent power efficiency scores during the sequential write test, but they aren't in the top tier of drives. The 250GB model averaged less power draw than any of the other drives in this batch, but its poor performance keeps the overall efficiency score low.
 |
|||||||||
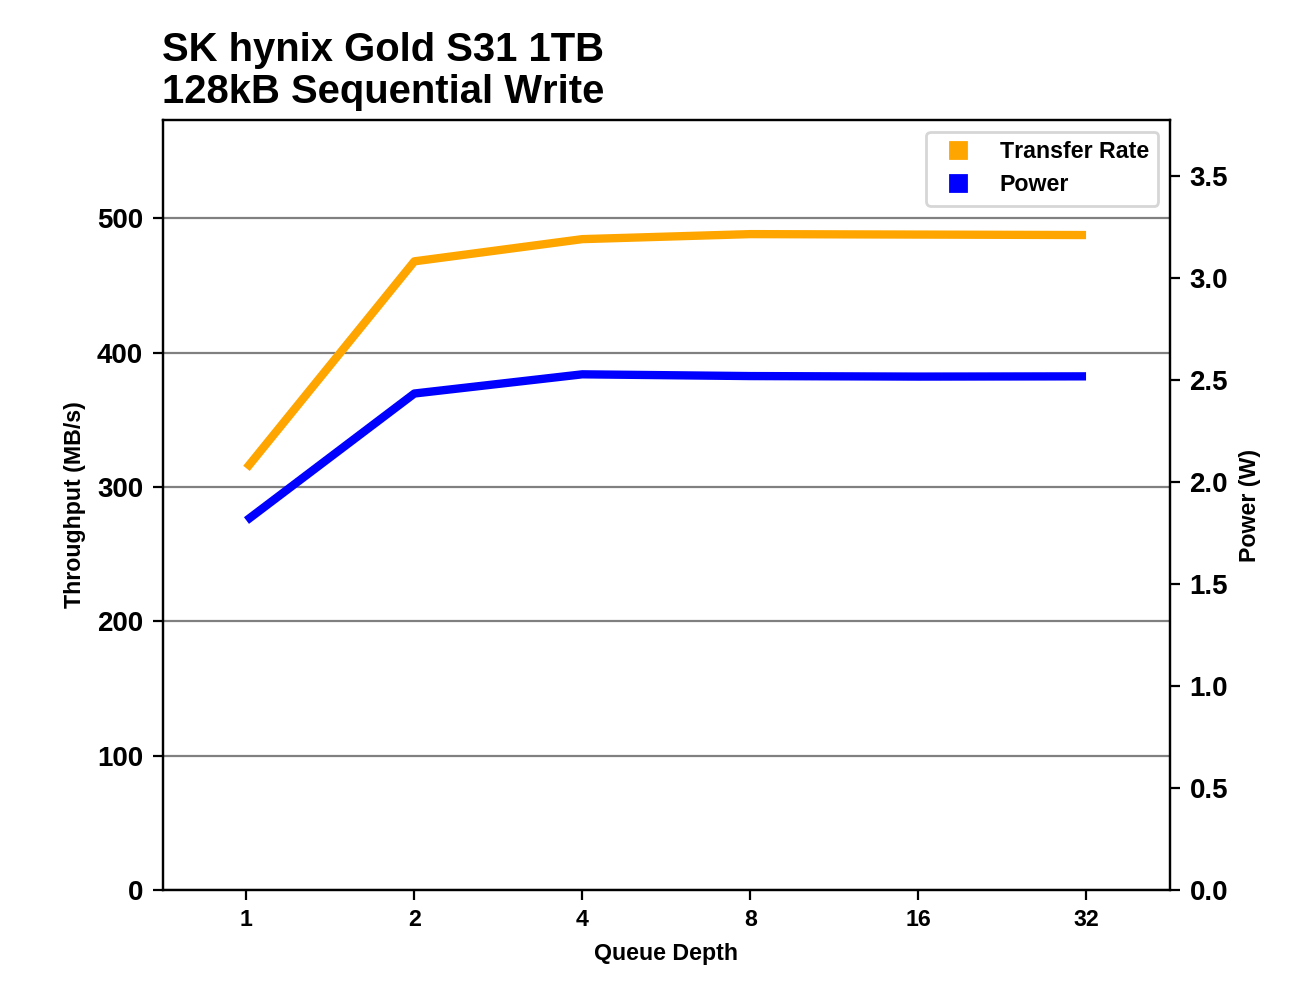
While getting full sequential read speeds out of the S31 required sufficiently high queue depths, the 500GB model is basically at its full speed at QD2 and the 250GB hardly gains anything from going past QD1.
As with sequential reads, the record of all sequential writes shows that the S31 is fairly average when it comes to power draw, and there's room for improvement.


22 Comments
View All Comments
jabber - Friday, November 15, 2019 - link
I think the thing is we are now at the point of diminishing returns. I find it hard to tell the everyday difference between running a desktop on a 550MBps SATA or a 3000MBps NVMe (NVMe was a real disappointment for the boost it gives). 20+ years ago if I got another 5FPS in Quake I could tell. Now if my games jump from 130FPS to 140FPS...meh.I was upgrading my CPU every 6 months at one point many years ago. Now it's lucky if i change it every 6 years...
Samus - Friday, November 15, 2019 - link
Actually a pretty impressive drive. The steady state performance is excellent. When I'm pushing out images to new PC's it's ridiculous a lot of the SSD's bottleneck even the network connection (which is realistically around 160MB/sec via (1Gbps Multicast) as you see it write VERY fast for the first half of a 15GB image then fall off.Imaging over USB 3.0 is totally brutal and only slightly faster than via the network. The SSD's are a mix of Intel OEM 540/545s drives and Micron 1100/1300 OEM drives, depending on the vendor. HP seems to use the Intel and Dell the Micron's. They're such shit all around drives for my job, but as you can imagine the users don't care because they're writing maybe a few GB a day via Outlook OST caching and general paging in Windows.