A Broadwell Retrospective Review in 2020: Is eDRAM Still Worth It?
by Dr. Ian Cutress on November 2, 2020 11:00 AM ESTCPU Tests: Office and Science
Our previous set of ‘office’ benchmarks have often been a mix of science and synthetics, so this time we wanted to keep our office section purely on real world performance.
Agisoft Photoscan 1.3.3: link
The concept of Photoscan is about translating many 2D images into a 3D model - so the more detailed the images, and the more you have, the better the final 3D model in both spatial accuracy and texturing accuracy. The algorithm has four stages, with some parts of the stages being single-threaded and others multi-threaded, along with some cache/memory dependency in there as well. For some of the more variable threaded workload, features such as Speed Shift and XFR will be able to take advantage of CPU stalls or downtime, giving sizeable speedups on newer microarchitectures.
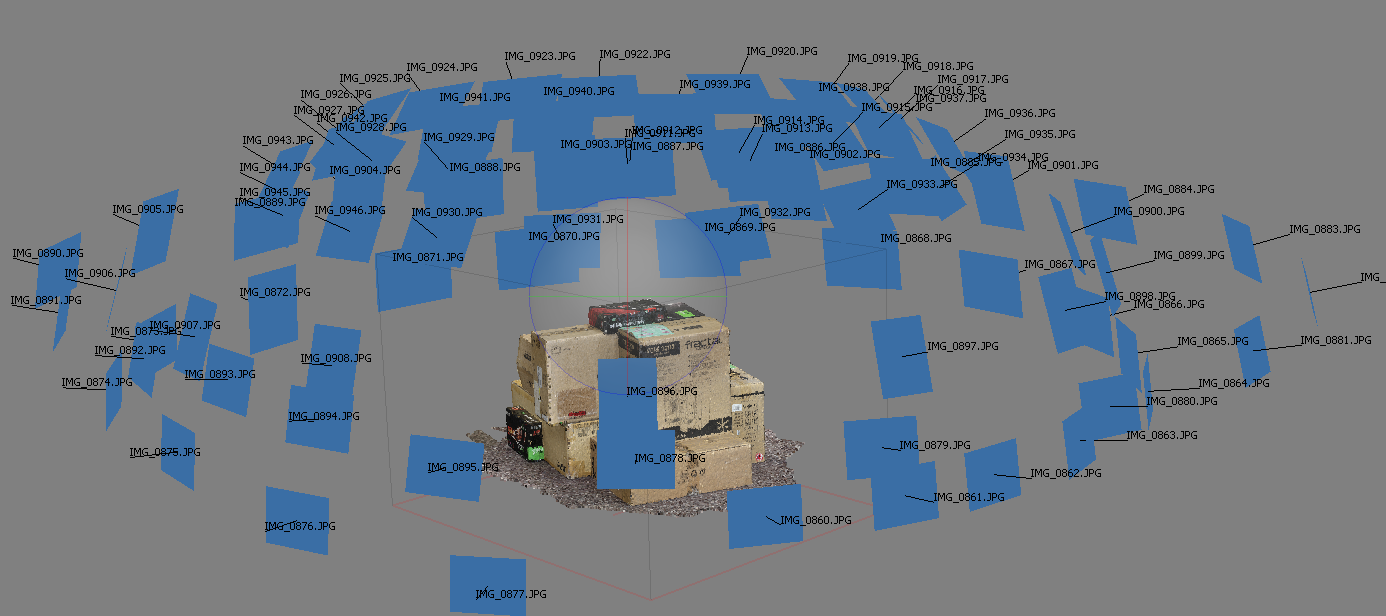
For the update to version 1.3.3, the Agisoft software now supports command line operation. Agisoft provided us with a set of new images for this version of the test, and a python script to run it. We’ve modified the script slightly by changing some quality settings for the sake of the benchmark suite length, as well as adjusting how the final timing data is recorded. The python script dumps the results file in the format of our choosing. For our test we obtain the time for each stage of the benchmark, as well as the overall time.
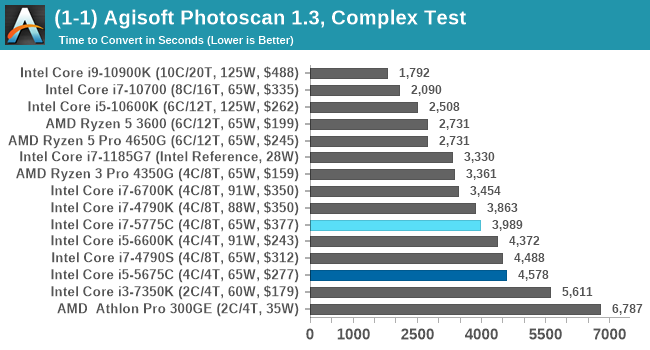
The extra power budget of the Devil's Canyon pulls ahead of the Core i7-5775C.
Application Opening: GIMP 2.10.18
First up is a test using a monstrous multi-layered xcf file to load GIMP. While the file is only a single ‘image’, it has so many high-quality layers embedded it was taking north of 15 seconds to open and to gain control on the mid-range notebook I was using at the time.
What we test here is the first run - normally on the first time a user loads the GIMP package from a fresh install, the system has to configure a few dozen files that remain optimized on subsequent opening. For our test we delete those configured optimized files in order to force a ‘fresh load’ each time the software in run.
We measure the time taken from calling the software to be opened, and until the software hands itself back over to the OS for user control. The test is repeated for a minimum of ten minutes or at least 15 loops, whichever comes first, with the first three results discarded.
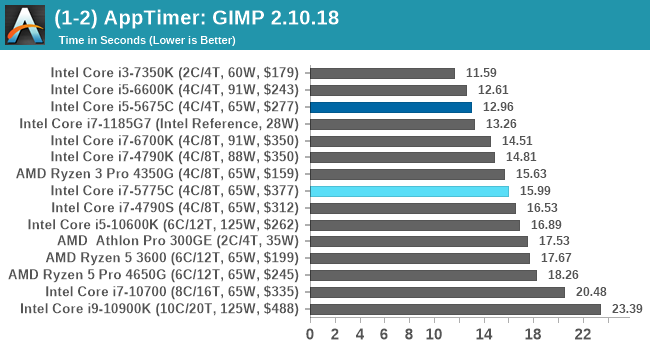
GIMP does optimizations for every CPU thread in the system, which requires that higher thread-count processors take a lot longer to run.
Science
In this version of our test suite, all the science focused tests that aren’t ‘simulation’ work are now in our science section. This includes Brownian Motion, calculating digits of Pi, molecular dynamics, and for the first time, we’re trialing an artificial intelligence benchmark, both inference and training, that works under Windows using python and TensorFlow. Where possible these benchmarks have been optimized with the latest in vector instructions, except for the AI test – we were told that while it uses Intel’s Math Kernel Libraries, they’re optimized more for Linux than for Windows, and so it gives an interesting result when unoptimized software is used.
3D Particle Movement v2.1: Non-AVX and AVX2/AVX512
This is the latest version of this benchmark designed to simulate semi-optimized scientific algorithms taken directly from my doctorate thesis. This involves randomly moving particles in a 3D space using a set of algorithms that define random movement. Version 2.1 improves over 2.0 by passing the main particle structs by reference rather than by value, and decreasing the amount of double->float->double recasts the compiler was adding in.
The initial version of v2.1 is a custom C++ binary of my own code, and flags are in place to allow for multiple loops of the code with a custom benchmark length. By default this version runs six times and outputs the average score to the console, which we capture with a redirection operator that writes to file.
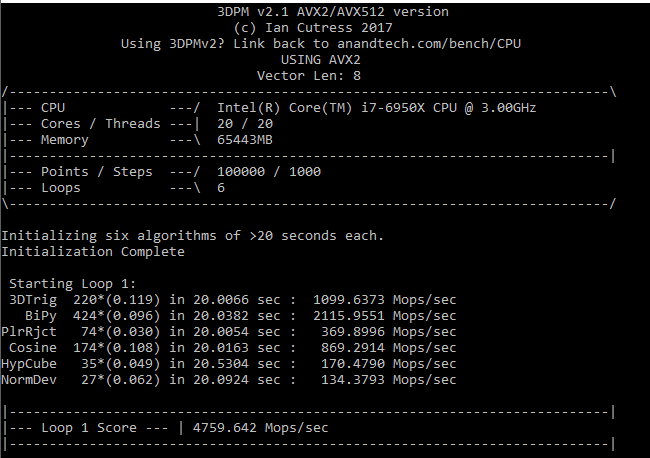
For v2.1, we also have a fully optimized AVX2/AVX512 version, which uses intrinsics to get the best performance out of the software. This was done by a former Intel AVX-512 engineer who now works elsewhere. According to Jim Keller, there are only a couple dozen or so people who understand how to extract the best performance out of a CPU, and this guy is one of them. To keep things honest, AMD also has a copy of the code, but has not proposed any changes.
The 3DPM test is set to output millions of movements per second, rather than time to complete a fixed number of movements.
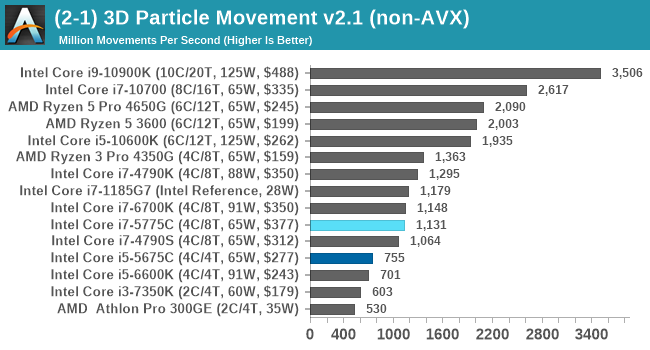
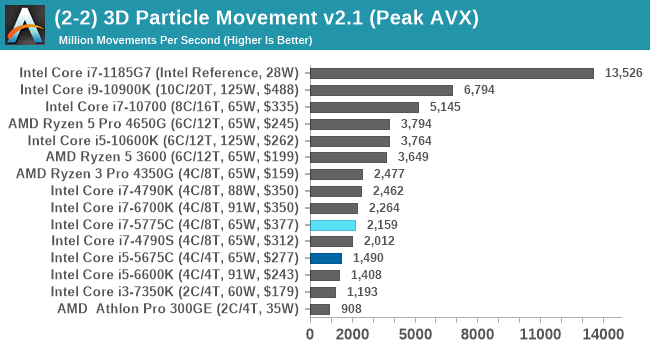
3DPM isn't memory limited, and as a result we see a relative natural order of performance.
y-Cruncher 0.78.9506: www.numberworld.org/y-cruncher
If you ask anyone what sort of computer holds the world record for calculating the most digits of pi, I can guarantee that a good portion of those answers might point to some colossus super computer built into a mountain by a super-villain. Fortunately nothing could be further from the truth – the computer with the record is a quad socket Ivy Bridge server with 300 TB of storage. The software that was run to get that was y-cruncher.
Built by Alex Yee over the last part of a decade and some more, y-Cruncher is the software of choice for calculating billions and trillions of digits of the most popular mathematical constants. The software has held the world record for Pi since August 2010, and has broken the record a total of 7 times since. It also holds records for e, the Golden Ratio, and others. According to Alex, the program runs around 500,000 lines of code, and he has multiple binaries each optimized for different families of processors, such as Zen, Ice Lake, Sky Lake, all the way back to Nehalem, using the latest SSE/AVX2/AVX512 instructions where they fit in, and then further optimized for how each core is built.
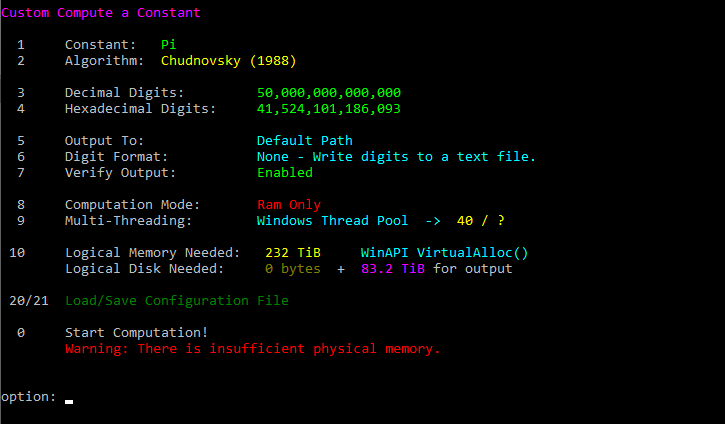
For our purposes, we’re calculating Pi, as it is more compute bound than memory bound. In single thread mode we calculate 250 million digits, while in multithreaded mode we go for 2.5 billion digits. That 2.5 billion digit value requires ~12 GB of DRAM, and so is limited to systems with at least 16 GB.
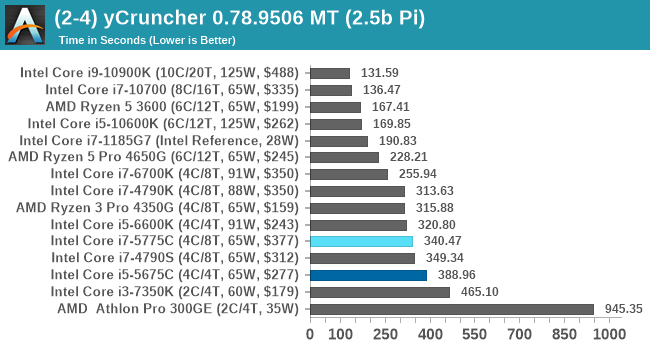
Despite being a more memory driven benchmark, y-Cruncher here follows a more traditional performance order.
NAMD 2.13 (ApoA1): Molecular Dynamics
One of the popular science fields is modeling the dynamics of proteins. By looking at how the energy of active sites within a large protein structure over time, scientists behind the research can calculate required activation energies for potential interactions. This becomes very important in drug discovery. Molecular dynamics also plays a large role in protein folding, and in understanding what happens when proteins misfold, and what can be done to prevent it. Two of the most popular molecular dynamics packages in use today are NAMD and GROMACS.
NAMD, or Nanoscale Molecular Dynamics, has already been used in extensive Coronavirus research on the Frontier supercomputer. Typical simulations using the package are measured in how many nanoseconds per day can be calculated with the given hardware, and the ApoA1 protein (92,224 atoms) has been the standard model for molecular dynamics simulation.
Luckily the compute can home in on a typical ‘nanoseconds-per-day’ rate after only 60 seconds of simulation, however we stretch that out to 10 minutes to take a more sustained value, as by that time most turbo limits should be surpassed. The simulation itself works with 2 femtosecond timesteps. We use version 2.13 as this was the recommended version at the time of integrating this benchmark into our suite. The latest nightly builds we’re aware have started to enable support for AVX-512, however due to consistency in our benchmark suite, we are retaining with 2.13. Other software that we test with has AVX-512 acceleration.
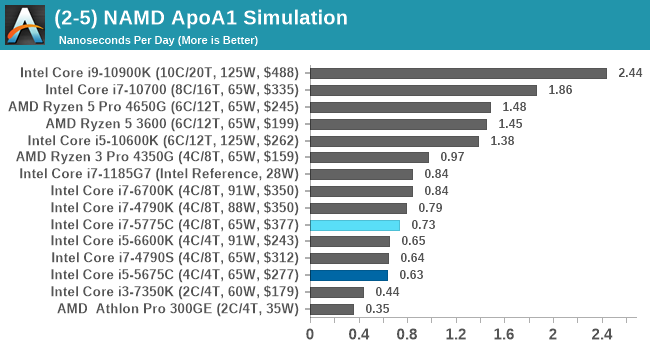
Similar to y-Cruncher, the extra DRAM doesn't afford any benefits for NAMD on this scale. The Devil's Canyon Core i7-4790K is still ahead of the Broadwell i7.
AI Benchmark 0.1.2 using TensorFlow: Link
Finding an appropriate artificial intelligence benchmark for Windows has been a holy grail of mine for quite a while. The problem is that AI is such a fast moving, fast paced word that whatever I compute this quarter will no longer be relevant in the next, and one of the key metrics in this benchmarking suite is being able to keep data over a long period of time. We’ve had AI benchmarks on smartphones for a while, given that smartphones are a better target for AI workloads, but it also makes some sense that everything on PC is geared towards Linux as well.
Thankfully however, the good folks over at ETH Zurich in Switzerland have converted their smartphone AI benchmark into something that’s useable in Windows. It uses TensorFlow, and for our benchmark purposes we’ve locked our testing down to TensorFlow 2.10, AI Benchmark 0.1.2, while using Python 3.7.6.

The benchmark runs through 19 different networks including MobileNet-V2, ResNet-V2, VGG-19 Super-Res, NVIDIA-SPADE, PSPNet, DeepLab, Pixel-RNN, and GNMT-Translation. All the tests probe both the inference and the training at various input sizes and batch sizes, except the translation that only does inference. It measures the time taken to do a given amount of work, and spits out a value at the end.
There is one big caveat for all of this, however. Speaking with the folks over at ETH, they use Intel’s Math Kernel Libraries (MKL) for Windows, and they’re seeing some incredible drawbacks. I was told that MKL for Windows doesn’t play well with multiple threads, and as a result any Windows results are going to perform a lot worse than Linux results. On top of that, after a given number of threads (~16), MKL kind of gives up and performance drops of quite substantially.
So why test it at all? Firstly, because we need an AI benchmark, and a bad one is still better than not having one at all. Secondly, if MKL on Windows is the problem, then by publicizing the test, it might just put a boot somewhere for MKL to get fixed. To that end, we’ll stay with the benchmark as long as it remains feasible.
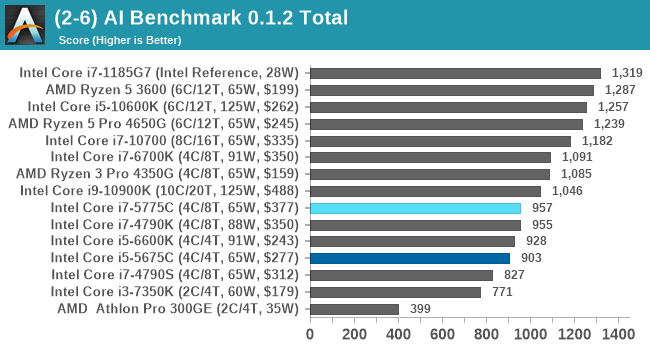
The AI-Benchmark (ETH) doesn't necessarily follow a standard performance candence due to MKL on Windows, but the Broadwell parts both score under 1000 pts here.


120 Comments
View All Comments
dsplover - Tuesday, November 3, 2020 - link
For Digital s Audio applications the i7-5775C @ 3.3GHz was incredible when disabling the Iris GFX turning the cache over to audio, then running s discrete GFX card.Bested my i7 4790k’s.
Tried OC’ing but even with the kick but Supermicro H70 it was unstable as the Ring Bus/L4 would also clock up and choked @ 2050MHz.
This rig allowed really tight low latency timings and I prayed they would release future designs with a larger cache.
AMD beat them to to it w/Matisse which was good for 8 core only.
The new 5000s are going to be Digital Audio dreams @ low wattage.
Intel just keeps lagging behind.
ironicom - Tuesday, November 3, 2020 - link
fps is irrelevant in civ; turn time and load time are what matter.vorsgren - Tuesday, November 3, 2020 - link
Thanks for using my benchmark! Hope it was usefull!Nictron - Wednesday, November 4, 2020 - link
Which benchmark was that?erotomania - Wednesday, November 4, 2020 - link
Google the username.vorsgren - Wednesday, November 4, 2020 - link
http://www.bay12forums.com/smf/index.php?topic=173...Oxford Guy - Thursday, November 5, 2020 - link
"The Intel skew on this site is getting silly its becoming an Intel promo machine!"Yes. An article that exposes how much Intel was able to get away with sandbagging because of our tech world's lack of adequate competition (seen in MANY tech areas to the point where it's more the norm than the exception) — clearly such an article is showing Intel in a good light.
If you were an Intel shareholder.
For everyone else (the majority of the readers), the article condemns Intel for intentionally hobbing Skylake's gaming performance. ArsTechnica produced an article about this five years ago when it became clear that Skylake wasn't going to have EDRAM.
The ridiculousness of the situation (how Intel got away with charging premium prices for horribly hobbled parts — $10 worth of EDRAM missing, no less) really shows the world's economic system particularly poorly. For all the alleged capitalism in tech, there certainly isn't much competition. That's why Intel didn't have to ship Skylake with EDRAM. Monopolization (and near-monopoly) enables companies to do what they want to do more than anything else: sell less for more. As long as regulators are toothless and/or incompetent the situation won't improve much.
erikvanvelzen - Saturday, November 7, 2020 - link
Ever since the Pentium 4 Extreme Edition I've wondered why intel does not permanently offer a top product with a large L3 or L4 cache.abufrejoval - Monday, November 9, 2020 - link
Just picked up a NUC8i7BEH last week (quad i7, 48EU GT3e with 128MB eDRAM), because they dropped below €300 including VAT: A pretty incredible value at that price point and extremely compatible with just about any software you can throw at it.Yes, Tiger Lake NUC11 would be better on paper and I have tried getting a Ryzen 7-4800U (as PN50-BBR748MD), but I've never heard of one actually shipped.
It's my second NUC8i7BEH, I had gotten another a month or two previously, while it was still at €450, but decided to swap that against a hexa-core NUC10i7FNH (24EU no eDRAM) at the same price, before the 14-days zero-cost return period was up. GT3e+quad-core vs. GT2+hexa-core was a tough call to make, but acutally both run really mostly server loads anyway. But at €300/quad vs €450/hexa the GT3e is quite simply for free, when the silicon die area for the GT3e/quad is in all likelyhood much greater than for the GT2/hexa, even without counting the eDRAM.
My Whiskey-lake has 200MHz less top clock than the Comet-lake, but that doesn't show in single core results, where the L4 seems to put Whiskey consistently into a small lead.
GT3e doesn't quite manage to double graphics performance over GT2, but I am not planning to use either for gaming. Both do fairly well at 4k on anything 2D, even Google Map's 3D renders do pretty well.
BTW: While Google Earth Pro's Flight simulator actually gives a fairly accurate representation of the area where I live, it doesn't do great on FPS, even with an Nvidia GPU. By contrast Microsoft latest and greatest is a huge disappointment when it comes to terrain accuracy (buildings are pure fantasy, not related at all to what's actually there), but delivers ok FPS on my RTX2080ti. No, I didn't try FlightSim on the NUCs...
However, the 3D rendering pipeline Google has put into the browser variant of Google Maps, beats the socks off both Google Earth Pro and Microsoft Flight: With Chrome leading over Firefox significantly, the 3D modelled environment is mind-boggling even on the GT2 at 4k resolutions, it's buttery smooth on GT3e. A browser based flight simulator might actually give the best experience overall, quite hard to believe in a way.
It has me appreciate how good even iGPU graphics could be, if code was properly tuned to make do with what's there.
And it exposes just how bad Microsoft Flight is with nothing but Bing map data unterneath: Those €120 were a full waste of money, but I just saved those from buying the second NUC8 later.
mrtunakarya - Wednesday, December 9, 2020 - link
<a href="https://www.mrtunakarya.com/?m=1">Nice<...