The Corsair MP400 1TB QLC NVMe SSD: A Quick Review
by Billy Tallis on December 11, 2020 2:00 PM ESTAnandTech Storage Bench - The Destroyer
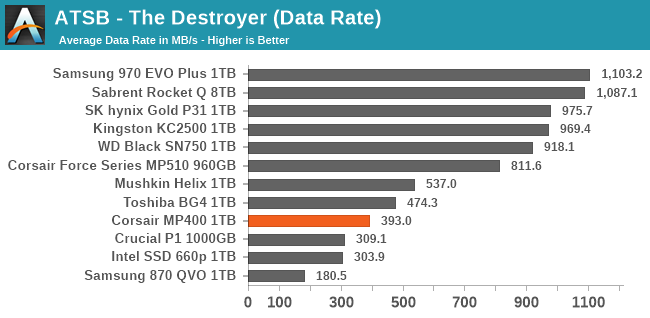
The Destroyer is an extremely long test replicating the access patterns of very IO-intensive desktop usage. A detailed breakdown can be found in this article. Like real-world usage, the drives do get the occasional break that allows for some background garbage collection and flushing caches, but those idle times are limited to 25ms so that it doesn't take all week to run the test. These AnandTech Storage Bench (ATSB) tests do not involve running the actual applications that generated the workloads, so the scores are relatively insensitive to changes in CPU performance and RAM from our new testbed, but the jump to a newer version of Windows and the newer storage drivers can have an impact.
We quantify performance on this test by reporting the drive's average data throughput, the average latency of the I/O operations, and the total energy used by the drive over the course of the test.
 |
|||||||||
| Average Data Rate | |||||||||
| Average Latency | Average Read Latency | Average Write Latency | |||||||
| 99th Percentile Latency | 99th Percentile Read Latency | 99th Percentile Write Latency | |||||||
| Energy Usage | |||||||||
The Corsair MP400 is faster on The Destroyer than the other 1TB QLC drives that are based on 4-channel controllers, but it's also generally slower than the DRAMless TLC drives. The MP400 and other QLC drives also require far more energy than the fairly efficient DRAMless TLC competition.
AnandTech Storage Bench - Heavy
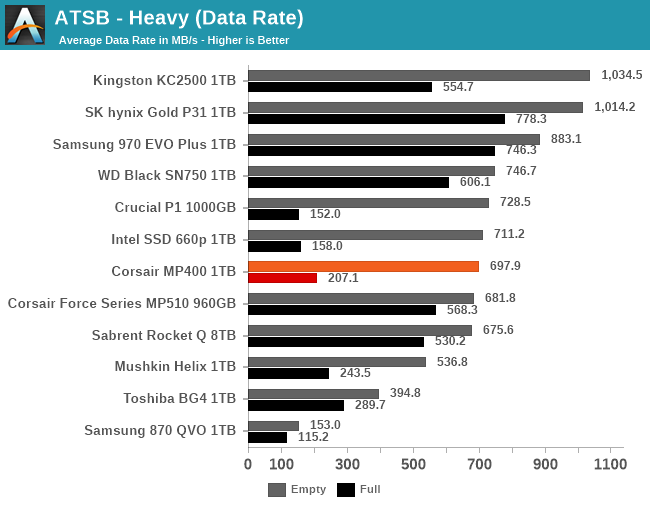
Our Heavy storage benchmark is proportionally more write-heavy than The Destroyer, but much shorter overall. The total writes in the Heavy test aren't enough to fill the drive, so performance never drops down to steady state. This test is far more representative of a power user's day to day usage, and is heavily influenced by the drive's peak performance. The Heavy workload test details can be found here. This test is run twice, once on a freshly erased drive and once after filling the drive with sequential writes.
 |
|||||||||
| Average Data Rate | |||||||||
| Average Latency | Average Read Latency | Average Write Latency | |||||||
| 99th Percentile Latency | 99th Percentile Read Latency | 99th Percentile Write Latency | |||||||
| Energy Usage | |||||||||
On the Heavy test, the Corsair MP400 and other QLC drives offer superior peak performance compared to the DRAMless TLC drives, but that situation is reversed when the test is run on a full drive. The MP400 in particular doesn't seem to be as good as the other QLC drives at maintaining decent read latency when full, but this test is very write-intensive so the MP400's overall performance on the full-drive test run is still better than the other QLC drives.
AnandTech Storage Bench - Light
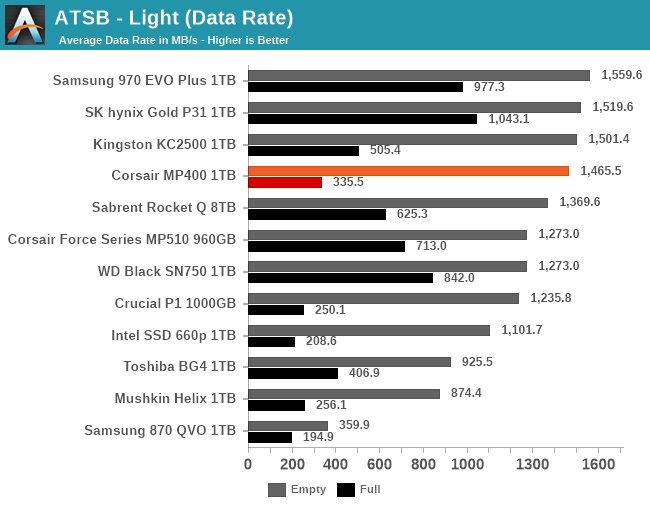
Our Light storage test has relatively more sequential accesses and lower queue depths than The Destroyer or the Heavy test, and it's by far the shortest test overall. It's based largely on applications that aren't highly dependent on storage performance, so this is a test more of application launch times and file load times. This test can be seen as the sum of all the little delays in daily usage, but with the idle times trimmed to 25ms it takes less than half an hour to run. Details of the Light test can be found here. As with the ATSB Heavy test, this test is run with the drive both freshly erased and empty, and after filling the drive with sequential writes.
 |
|||||||||
| Average Data Rate | |||||||||
| Average Latency | Average Read Latency | Average Write Latency | |||||||
| 99th Percentile Latency | 99th Percentile Read Latency | 99th Percentile Write Latency | |||||||
| Energy Usage | |||||||||
The Light test is short enough to fit entirely within the SLC cache of the 1TB Corsair MP400 when the test is run on an empty drive. That allows the MP400 to outperform the 8TB Sabrent Rocket Q, which is burdened with extra overhead of managing so much flash. The DRAMless TLC drives cannot match the peak performance of the QLC drives that have DRAM. When the test is run on a full drive, the performance of the QLC drives as usual suffers greatly, but the Corsair MP400 remains faster than at least some of the DRAMless TLC drives.


75 Comments
View All Comments
Spunjji - Monday, December 14, 2020 - link
Yes, the drive is absolutely fine for its intended use case and completely inappropriate when used in ways which were not intended (and where its performance would be miserable anyway). 🥱In terms of my usage, for example, it's less "almost disposable" and more "extremely unlikely to wear out before it becomes useless in what will be my current system 10-15 years from now".
zdz - Friday, December 11, 2020 - link
Don't need to look at Samsung. Corsair MP500 1 TB (previous generation model) had 1700 TBW. Eight times more. Today's drive are becoming creap.zdz - Friday, December 11, 2020 - link
I meant mp510, sorry.Makaveli - Saturday, December 12, 2020 - link
Yup the Corsair MP600 1TB which is based on the E16 controller is rated for 1800TBW.Maverick009 - Friday, December 11, 2020 - link
You are talking about 2 similarly but differently marketed drives, the Samsung 860 EVO is a step up or step down from QLC drives depending on how you look at it. The actual 200TBW or 600TBW is based slightly on warranty, data written to drive, along with a few other metrics, but in majority of cases an SSDs life will last several years to decades before it gives out. Well past the purchase date and in some cases past your lifetime.GeoffreyA - Saturday, December 12, 2020 - link
Using Kristian's 850 Evo calculations as a guide, I got the following values, assuming a 1,000 p/e cycle for QLC on a 1 TB drive:20 GB/day (with 1.5x write amp) == 93.52 years
50 GB/day (1.5x w.a.) == 37.4 y
100 GB/day (3x w.a.) == 9.35 y
Hopefully, I didn't muck it all up :)
Spunjji - Monday, December 14, 2020 - link
Nice! Looks like it would be perfectly suitable for the lower-end users that QLC drives are aimed at.But hey, number go down, so all the NAND ranters have a sad.
GeoffreyA - Tuesday, December 15, 2020 - link
I'm sure the Fact Rewriting Squad can work wonders with those values ;)joesiv - Monday, December 14, 2020 - link
Good idea using P/E cycles.Just remember, OS writes != NAND writes.
There are other factors that will increase the WAF (Write Amplification Factor).
It's totally not uncommon to have a WAF of 2x, but if there are bugs, or firmwares too focused on speed or particular usage scenarios, the WAF can be much much higher.
Basically, it needs to be tested.
SMART data may provide this for you, look at your Average Nand writes.
If you're at 10, then you're 1/100th through your 1000 P/E cycles. You can calculate out how many GB/TB's you've used by using the life expecancy the manufactuers advertise (200TB?), divided by that ratio, to find actual NAND writes (if the SMART CTL isn't giving it to you)
Good luck!
GeoffreyA - Tuesday, December 15, 2020 - link
Had a crack at this earlier. Attributes were a bit obscure, but after some research, took value 241, LBAs written, and multiplied by 512 to work out bytes. From there, got about 2.28 TB or so, which squares with the ~2.4 TB value in Hwinfo. It's an 860 Evo 500 GB, just over a year old. I hardly play games or anything any more, so that's why the writes are so low. Also, round about May, put in a mechanical drive that was just collecting dust. It works well for storing films. Before that, space was a battle on the SSD.