How We Test PCIe 4.0 Storage: The AnandTech 2021 SSD Benchmark Suite
by Billy Tallis on February 1, 2021 1:15 PM ESTStorage Benchmark Considerations
Storage benchmarks can be classified into three main categories, each of which serves a different purpose.
Application Benchmarks
Application benchmarks involve real programs and measures performance as perceived by the user. As compared to other benchmark types, a well-designed application benchmark provides the best assessment of overall system performance. In principle, there's nothing really storage-specific here: you can pick any one component to swap out while holding the rest of the system configuration constant, and end up with a valid test.
An application benchmark can be as simple as performing a common task (eg. booting the OS, launching a game) while using a stopwatch. But that kind of testing is labor-intensive and error-prone. A good suite of automated application benchmarks is a lot of work to assemble. Well-known application benchmark suites include UL's PCMark and BapCo's SYSmark, which represent relatively light desktop usage. The tests don't occupy much disk space and don't perform all that much IO in aggregate. They are also almost completely devoid of the kinds of bursts of intense IO that are where fast storage pays off. As a result, these tests show very little difference in overall scores between the fastest and slowest storage configurations. This is an accurate assessment, but only for the kinds of storage-light workloads represented by these tests.
Additionally, application benchmarks have a fundamental limitation: they tell you almost nothing about why one drive ends up performing better or worse than another. This makes it impossible to reliably extrapolate application benchmark scores to dissimilar workloads. PCMark and SYSmark scores can't help you predict how your system will perform when you start launching lots of virtual machines and filling up the drive.
IO Traces
Storage IO traces are a live recording of the read and write operations performed by a real-world workload. Every read and write operation is logged along with its timestamp, the size of the data transfer and the disk sectors involved. This can add up to quite a bit of data, even when the contents of the data transfers are not logged (ie. the trace only specifies that a 1MB write was performed, but doesn't actually save a copy of that MB of data). IO traces can be analyzed in depth after the fact to see what kind of queue depths were involved, how much IO was sequential vs random, etc. Statistics can also be computed for a subset of the IO operations logged, such as analyzing read operations and write operations separately.
Recorded IO traces can also be played back, replicating the original IO patterns in a highly repeatable manner, and without needing to re-run the applications that originally generated the IO workload. This takes CPU, RAM, and GPU speed largely out of the equation, so it's easier to compare storage performance across different machines. Benchmarks built around storage trace playback focus specifically on storage performance rather than overall system performance/responsiveness, so their scores can exaggerate the performance differences between hardware configurations, as compared to using metrics that measure overall system performance.
Since trace-based storage benchmarks allow a much greater depth of analysis than application benchmark scores, they can provide insight into what specific performance characteristics enable one drive to provide better application-level performance than another.
Synthetic Benchmarks
Lastly, synthetic benchmarks for storage consist of IO patterns generated and measured by special-purpose tools: for example, using CrystalDiskMark to measure 4kB random read performance at a particular queue depth. In one sense, these test are the simplest to describe and understand (at least if the test configuration is relatively simple). However, their relevance to the real world is not so simple. It's easy to configure a synthetic benchmark that is reliable, repeatable, and says nothing useful about real-world performance. This is done deliberately by PR departments, but can also happen accidentally. And changes in SSD technology can make formerly-useful synthetic tests invalid for use on newer drives. On the other hand, sometimes we can use deliberately unrealistic synthetic tests to infer things about the internal workings of a SSD. It's also theoretically possible to configure a synthetic test to generate a workload that statistically resembles real-world IO patterns, with a varied mix of IO sizes, queue depths, and idle times—but it's usually easier to use a trace-based benchmark for this purpose.
Operating Systems
At least until Microsoft delivers DirectStorage for Windows, Linux is the best OS choice for pushing the performance limits of storage hardware with low software overhead. But more importantly, Linux offers much greater transparency and control over hardware, which is what allows us to perform highly automated testing including trying out all the different power management options supported (or not) by SSDs. The synthetic benchmarks in this test suite are all conducted using the Flexible I/O tester (Fio) version 3.25 running on Linux. This tool is very deserving of its name: the dizzying array of options allows it to be used to test all kinds of IO patterns, and this test suite only scratches the surface of what's possible.
Our trace-based tests (AnandTech Storage Bench, and PCMark 10's Storage tests) are Windows-based tests, and any application benchmarks that we make a regular part of our test suite will also be Windows-based. We're using Windows 10 version 20H2.
Testbed Hardware
Most of our new SSD test suite makes use of an AMD Ryzen-based desktop with relatively moderate specs, but providing the PCIe 4.0 support necessary for the latest generation of NVMe SSDs. Our synthetic and trace-based don't require much compute power, so this system gets away with a 6-core processor, B550 chipset, and no GPU—leaving both the PCIe x16 and M.2 slots connected directly to the CPU available for testing at PCIe 4.0 speeds. The boot drive is a Samsung 960 PRO in the M.2 slot that is connected through the B550 chipset and therefore limited to PCIe 3.0 speeds.
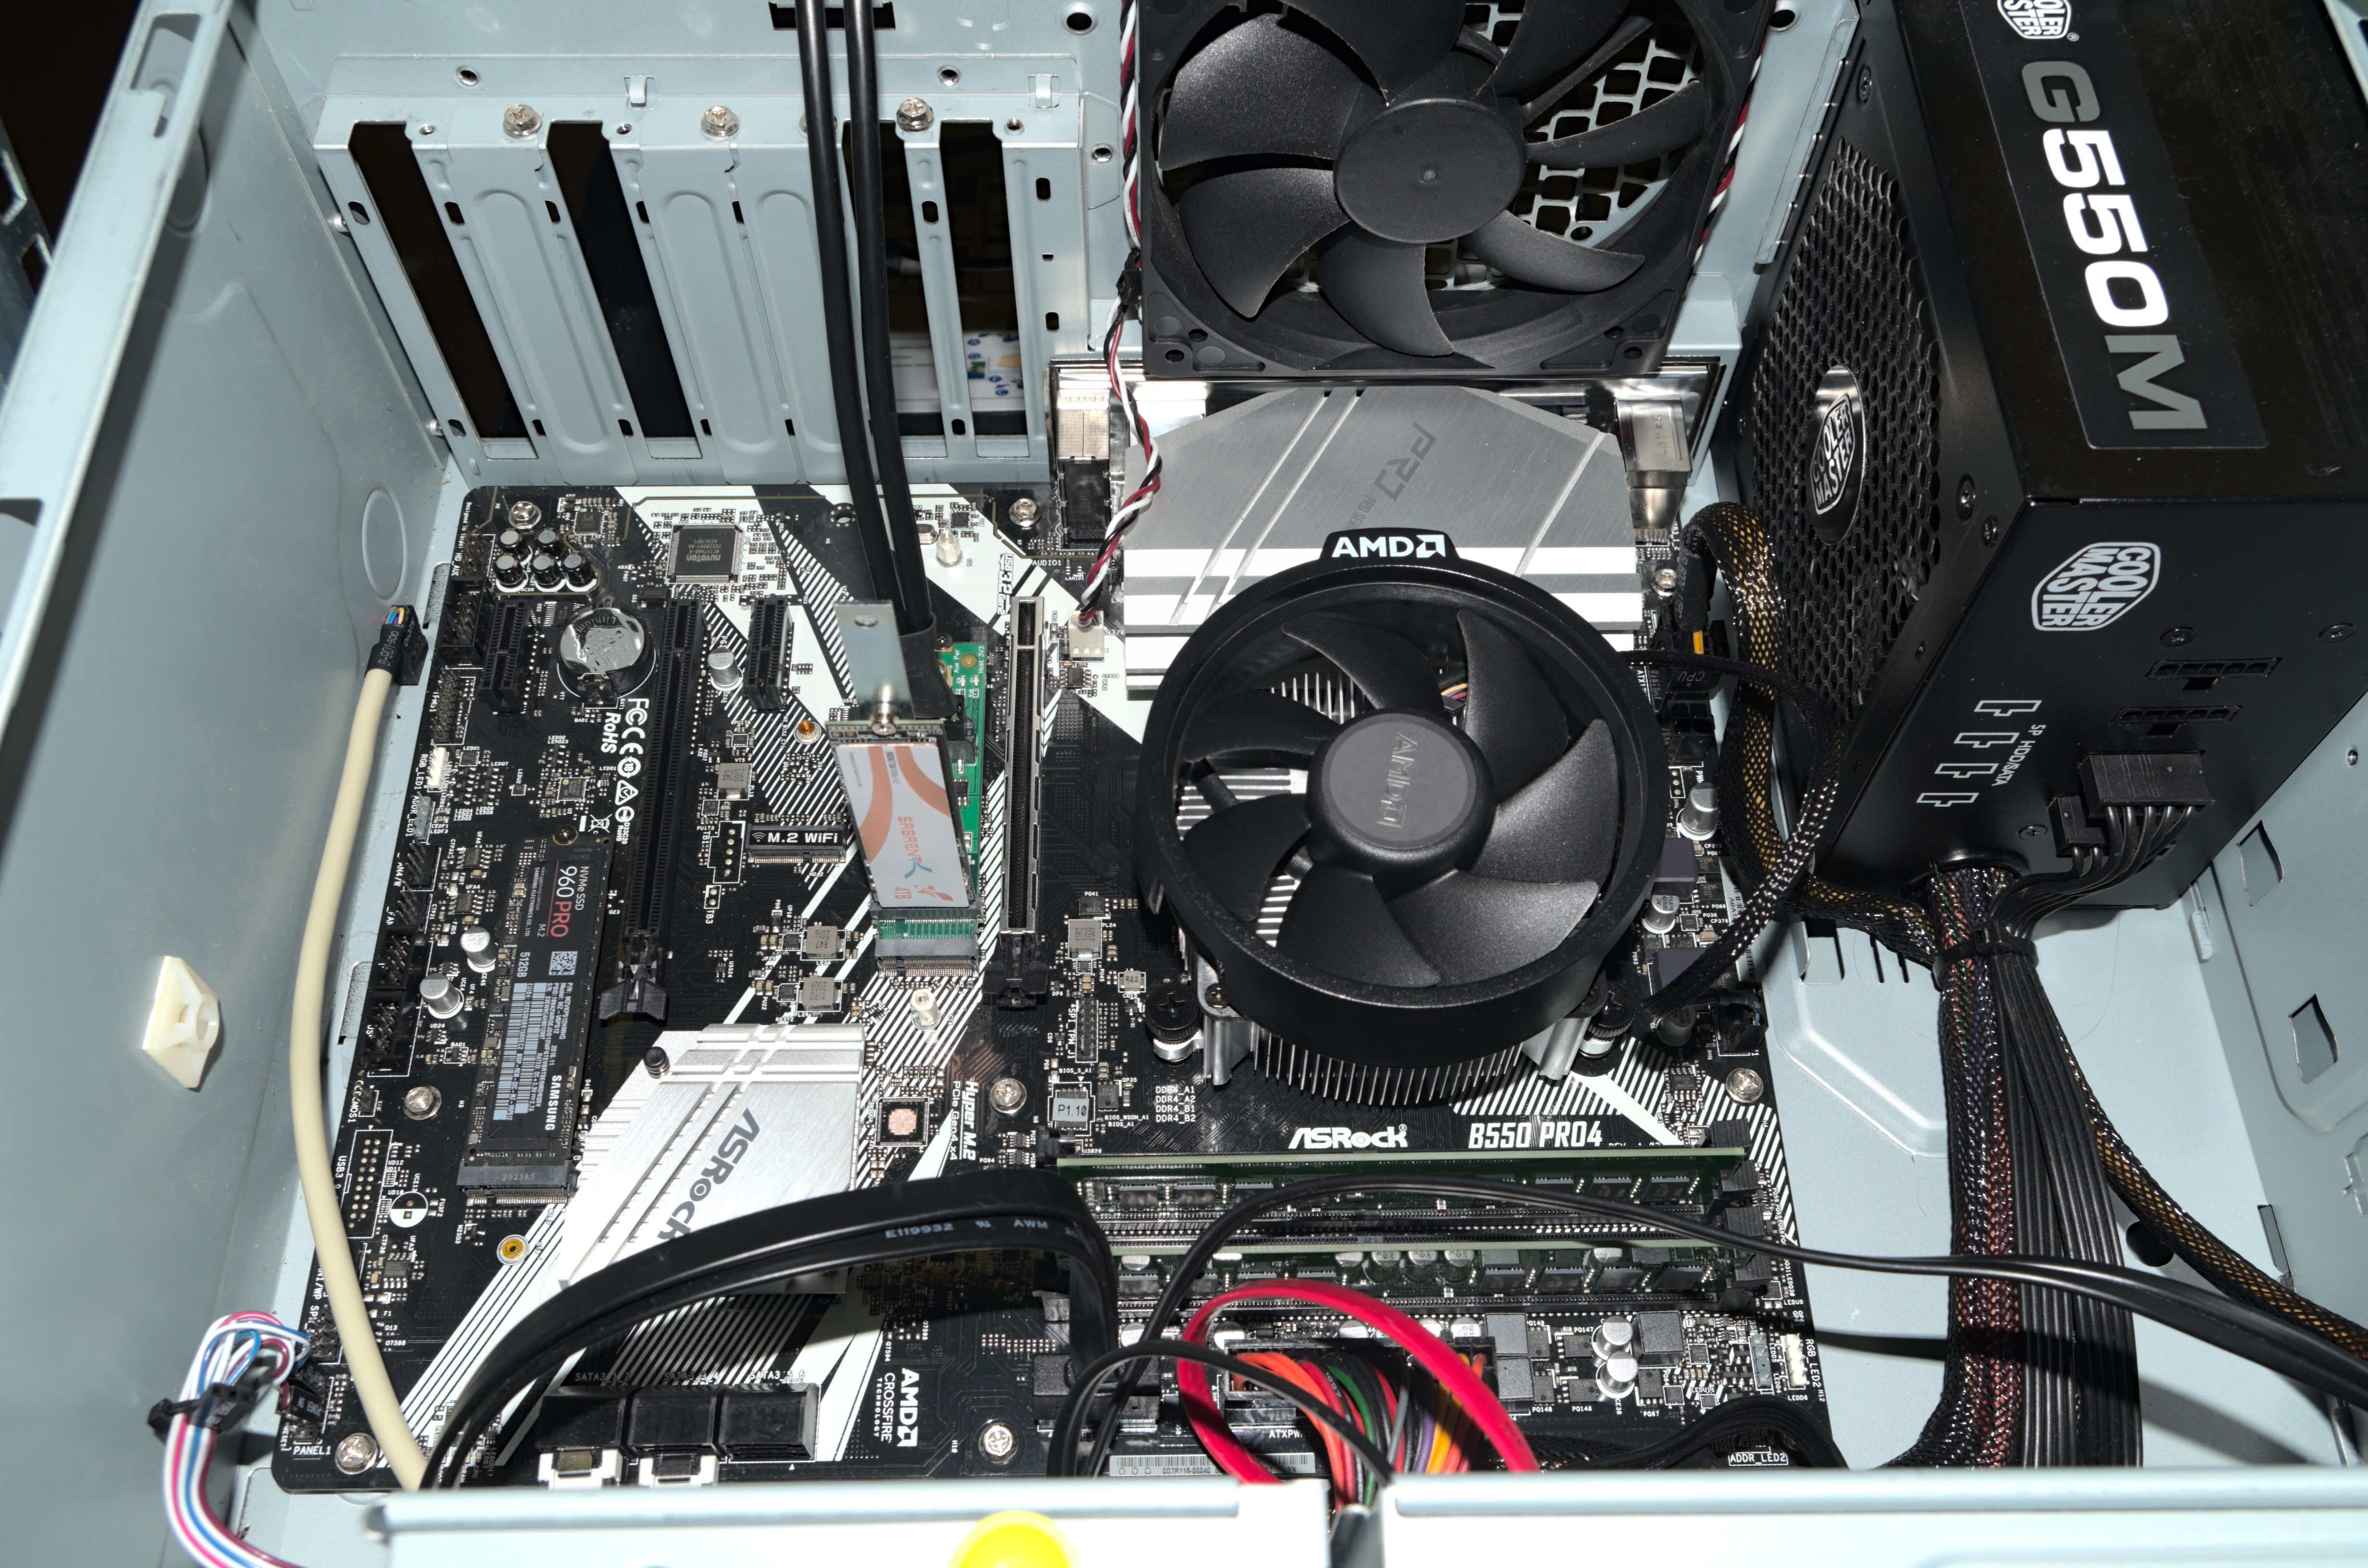
| AnandTech 2021 Consumer SSD Testbed | |
| CPU | AMD Ryzen 5 3600X |
| Motherboard | ASRock B550 Pro BIOS L1.42 |
| Memory | 2x 16GB Kingston DDR4-3200 |
| Software | Linux 5.10, FIO 3.25 Windows 10 version 20H2 |
We also have a more high-end Ryzen desktop, provided by Western Digital along with their SN850 SSD. This one uses AMD's 16-core Ryzen 9 3950X, slightly faster RAM, and includes a Radeon RX 580 GPU. Our plan is to use this system for application benchmarks like PCMark 10 and SYSmark 25, but at the moment we are unable to get either one of those tests to reliably run to completion on this system when using recent builds of Windows 10. Once we can find a stable and reasonably up-to-date software and driver configuration for this system, we'll also try using it for some game loading time benchmarks. This system is also planned to be our new enterprise SSD testbed, taking over from our dual-socket Intel Skylake 2U server which is still overkill for most of our storage tests, but lacks PCIe 4.0 support.
| AnandTech 2021 Consumer SSD Testbed - Application Benchmarks | |
| CPU | AMD Ryzen 9 3950X |
| Motherboard | ASUS ROG Crosshair VIII Hero |
| Memory | 2x 16GB Mushkin DDR4-3600 |
| GPU | AMD Radeon RX 580 8GB (XFX) |
Neither of our new Ryzen testbeds is capable of using the lowest-power PCIe Active State Power Management (ASPM) modes that laptops rely on, so our idle power measurement tests remain on an older Intel Coffee Lake desktop, updated with the latest software, firmware and microcode.
| Coffee Lake SSD Testbed for Idle Power | |
| CPU | Intel Core i7-8700K |
| Motherboard | Gigabyte Aorus H370 Gaming 3 WiFi BIOS F14d |
| Memory | 2x 8GB Kingston DDR4-2666 |
| Software | Linux 5.10, FIO 3.25 |
Almost all components of these testbeds are run of the mill desktop hardware. To measure power consumption of individual drives, we also have some highly specialized equipment provided by Quarch Technology. Their HD Programmable Power Module is a power supply that provides simultaneous measurement of voltage and current on its 12V and 5/3.3V supply rails, with readings taken every 4 microseconds. The HD PPM is a bit larger than an optical disc drive, and feeds power to the SSD under test using any of several different power injection fixtures.
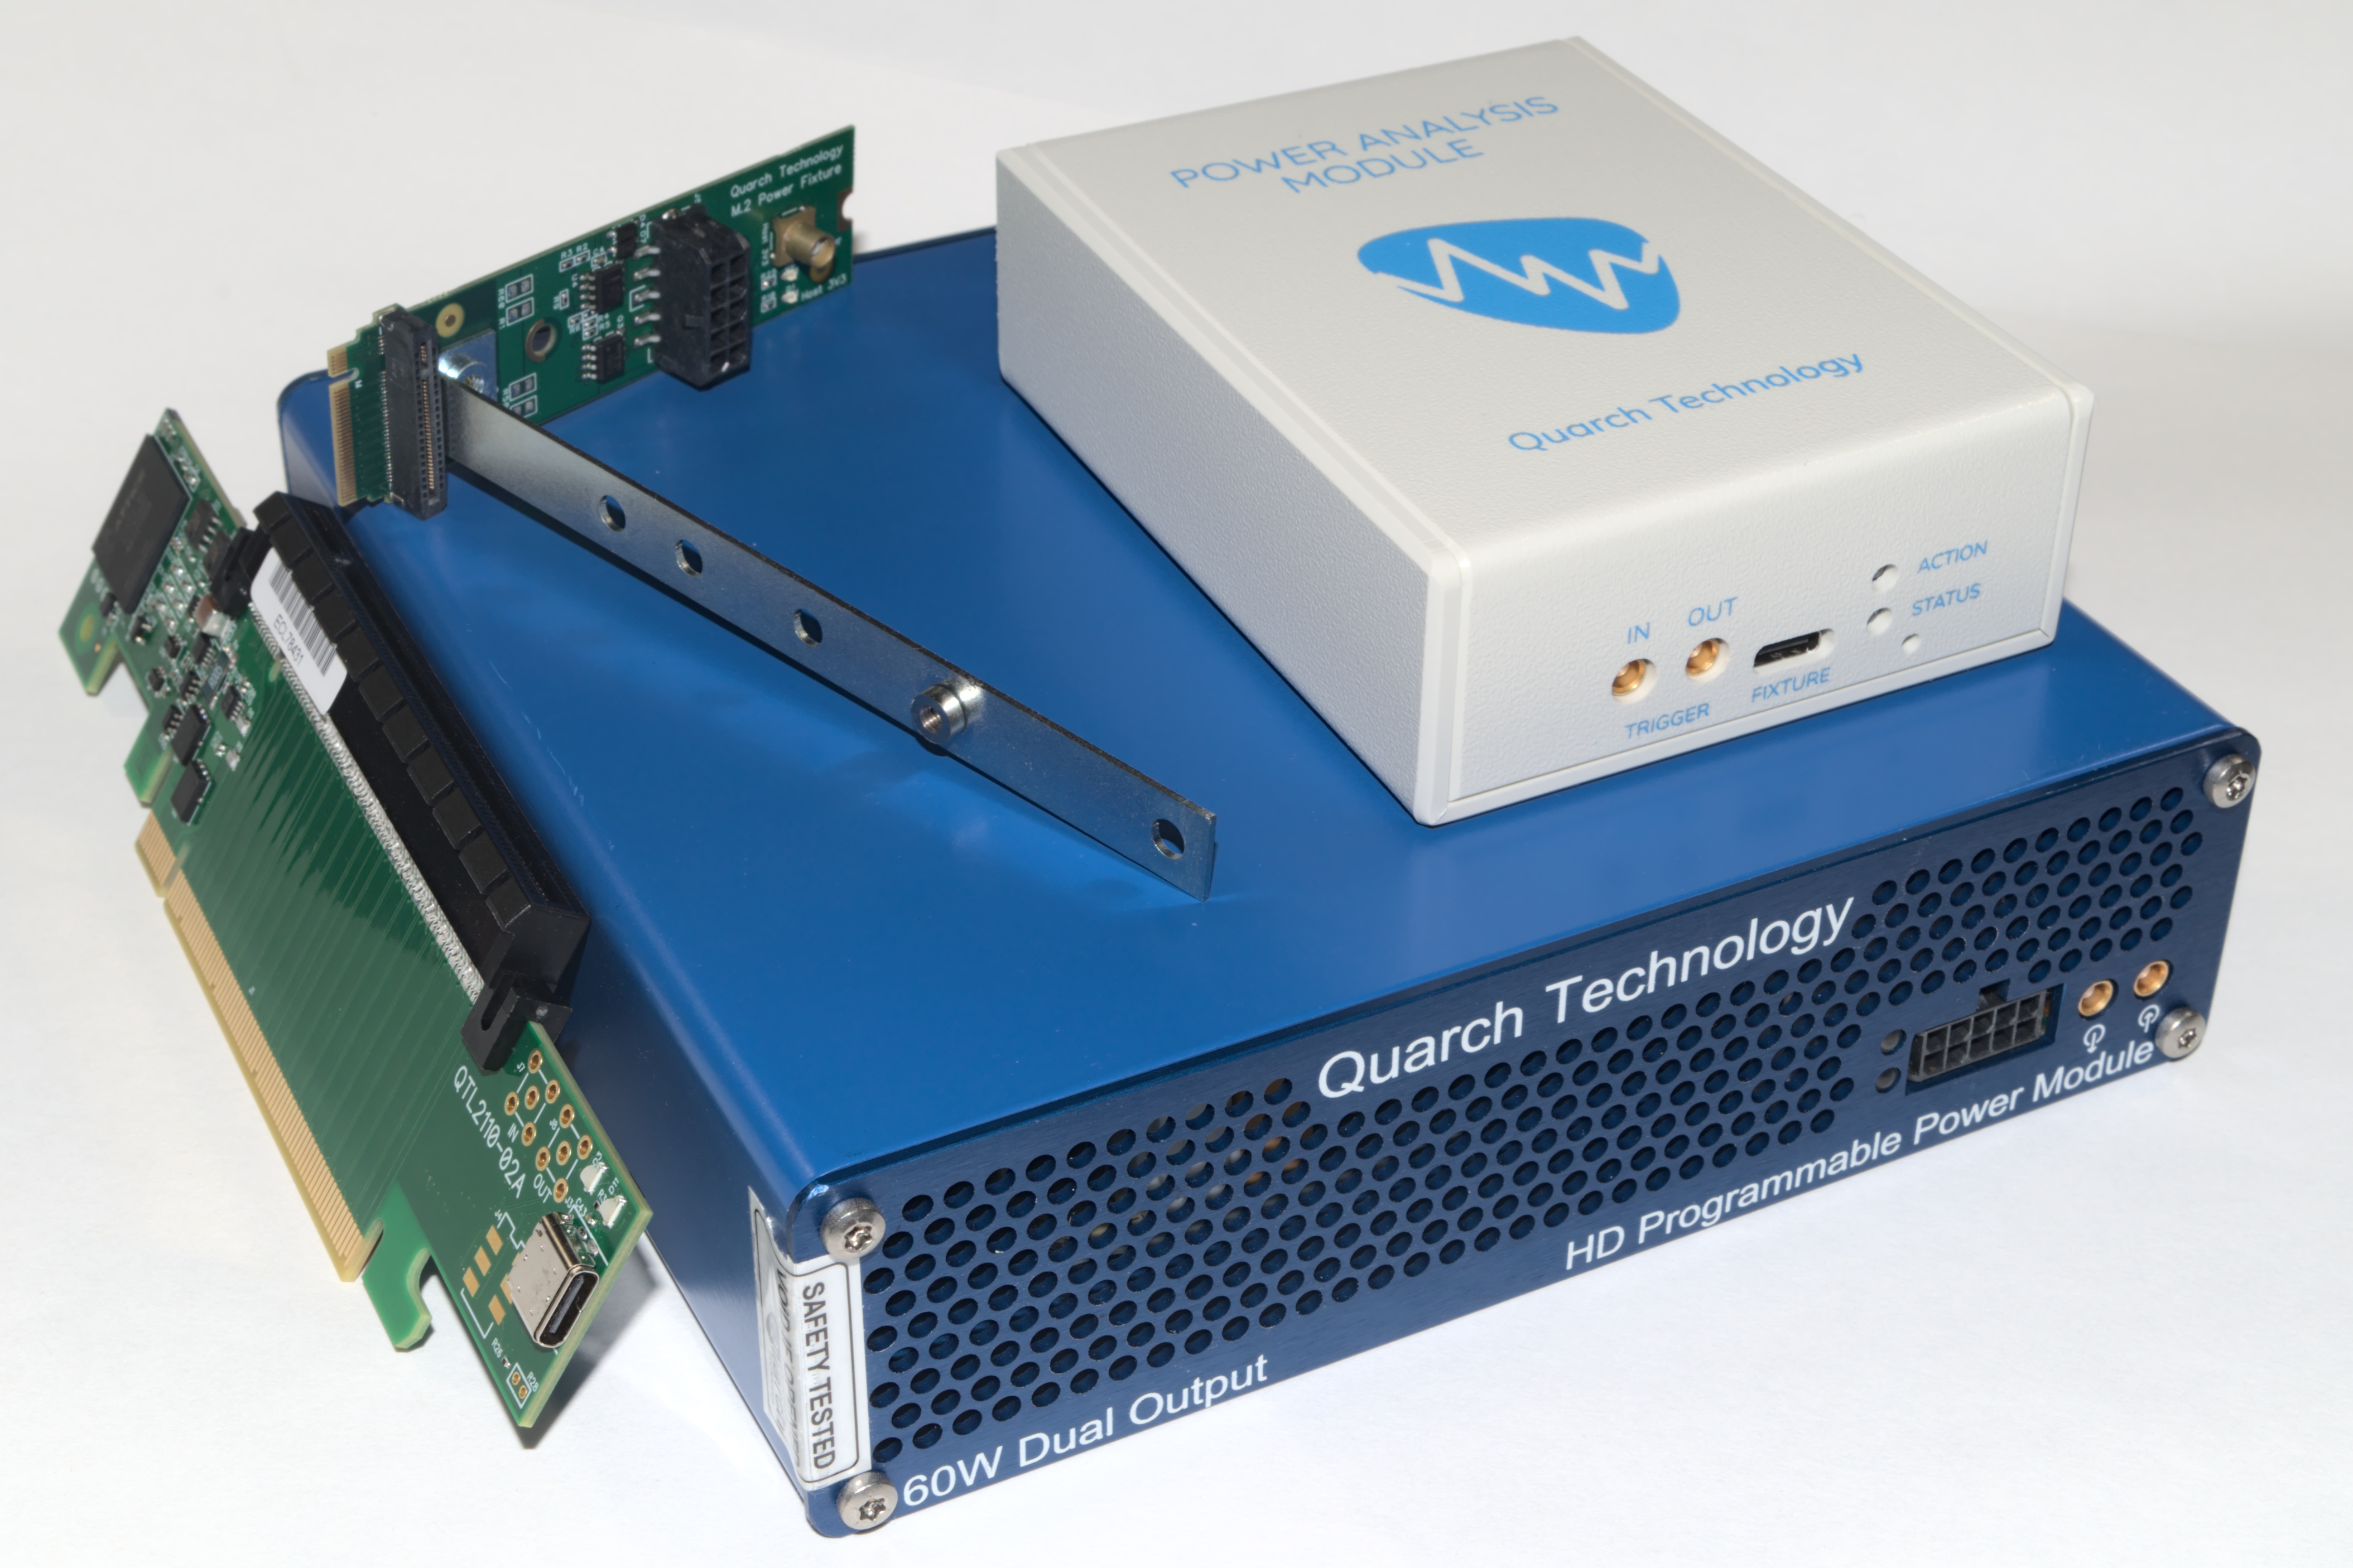


Quarch has also recently introduced the Power Analysis Module (PAM). This moves the measurement hardware (ADCs, etc.) onto the form factor-specific fixture itself, and relies on the host system to power the drive instead of the PAM serving as a power supply. We still get the same high-precision measurements, but the PAM is now a much smaller fanless box that just handles translation and buffering of the data stream.


70 Comments
View All Comments
IanCutress - Tuesday, February 2, 2021 - link
Some people see sequential reads at QD128 as the 'holy' unified metric ;)Samuel Vimes - Monday, February 1, 2021 - link
Great to see this updated test suite.Would love to see popular SSDs like Corsair MX500, BX500 and Samsung 970 EVO Plus incorporated as reference points.
Also, a note to put numbers in perspective (e.g., "in this test, a 10% difference is/isn't significant")—like in sound measurements where we know +10 dB is twice the perceived sound and we have dB(A), in SSD measurements what amount of difference matters in different scenarii (data loaders, gamers, office use...)?
oRAirwolf - Monday, February 1, 2021 - link
Very nice. Also nice to see some additional validation of the SK Hynix Gold P31 results. My only complaint with that SSD, which I installed in my XPS 17 9700, is that it does not support hardware encryption with bitlocker. There is definitely a significant performance penalty when testing performance in Crystal Disk Mark with software encryption enabled and disabled. Sad times.svan1971 - Monday, February 1, 2021 - link
where is the fastest 4.0 M.2 ? The Sabrent Rocket 4 Plus ?Beaver M. - Monday, February 1, 2021 - link
Deleting critical comments now, are we?Ryan Smith - Tuesday, February 2, 2021 - link
No comments have been deleted. I only delete them in the most egregious of circumstances, and never for being critical.Deicidium369 - Tuesday, February 2, 2021 - link
Thank, I needed a good laugh - I guess contradicting Ian Cutress is egregious - not in this article - but the badly botched Xe HPC write up.Slippery slope leading to Tom's Hardware level of protecting the fee fees of "editors".
Martin84a - Sunday, February 7, 2021 - link
Well one of your writers certainly do. I pointed out that it's incorrect to write 2TB, 2MB, 2MHz, 2mm etc. and that it's incorrect to write 2Mb when you mean 2 MB (megabyte), and that I was surprised to see such a lack of consistency on Anandtech. *Deleted*.Martin84a - Sunday, February 7, 2021 - link
For those not getting it, the ISO standard, IEC and writing it as a proper SI unit all specify that the numerical value always precedes the unit, and that is always used to separate the unit from the number.Martin84a - Tuesday, February 9, 2021 - link
*a space is always used.