Samsung MUF-256DA USB-C Flash Drive Review: Thumb-Sized Performance Consistency
by Ganesh T S on July 6, 2022 8:00 AM EST- Posted in
- Storage
- Samsung
- Flash Drive
- flash
- DAS
- Type-C
- Portable SSDs
Portable SSDs have seen great demand over the last few years. Thanks to advancements in smartphones, the amount of user-generated content that needs to be backed up or transferred from one device to another has grown exponentially. While native flash controllers are now capable of delivering USB 3.2 Gen 2x2 (20 Gbps) speeds with the latest 3D NAND, the ubiquitous thumb drive (called UFDs - short for USB flash drives) has also managed to evolve. Unlike high-performance portable SSDs, these UFDs are merchant products - under blind tests, most users wouldn't be able to differentiate a product in one performance class from another vendor's offering in the same class. We rarely review thumb drives (having made exceptions for the Mushkin Atom and Strontium Nitro Plus Nano in the past, thanks to some unique aspects), but Samsung's offer of the MUF-256DA/AM USB Type-C Flash Drive piqued our interest. Having last reviewed a compact UFD back in 2016, we also wanted to check out the improvements made in this product category over the years.
Introduction and Product Impressions
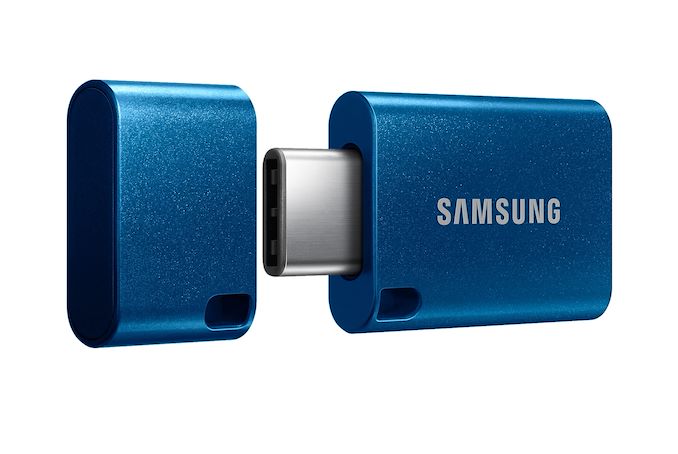
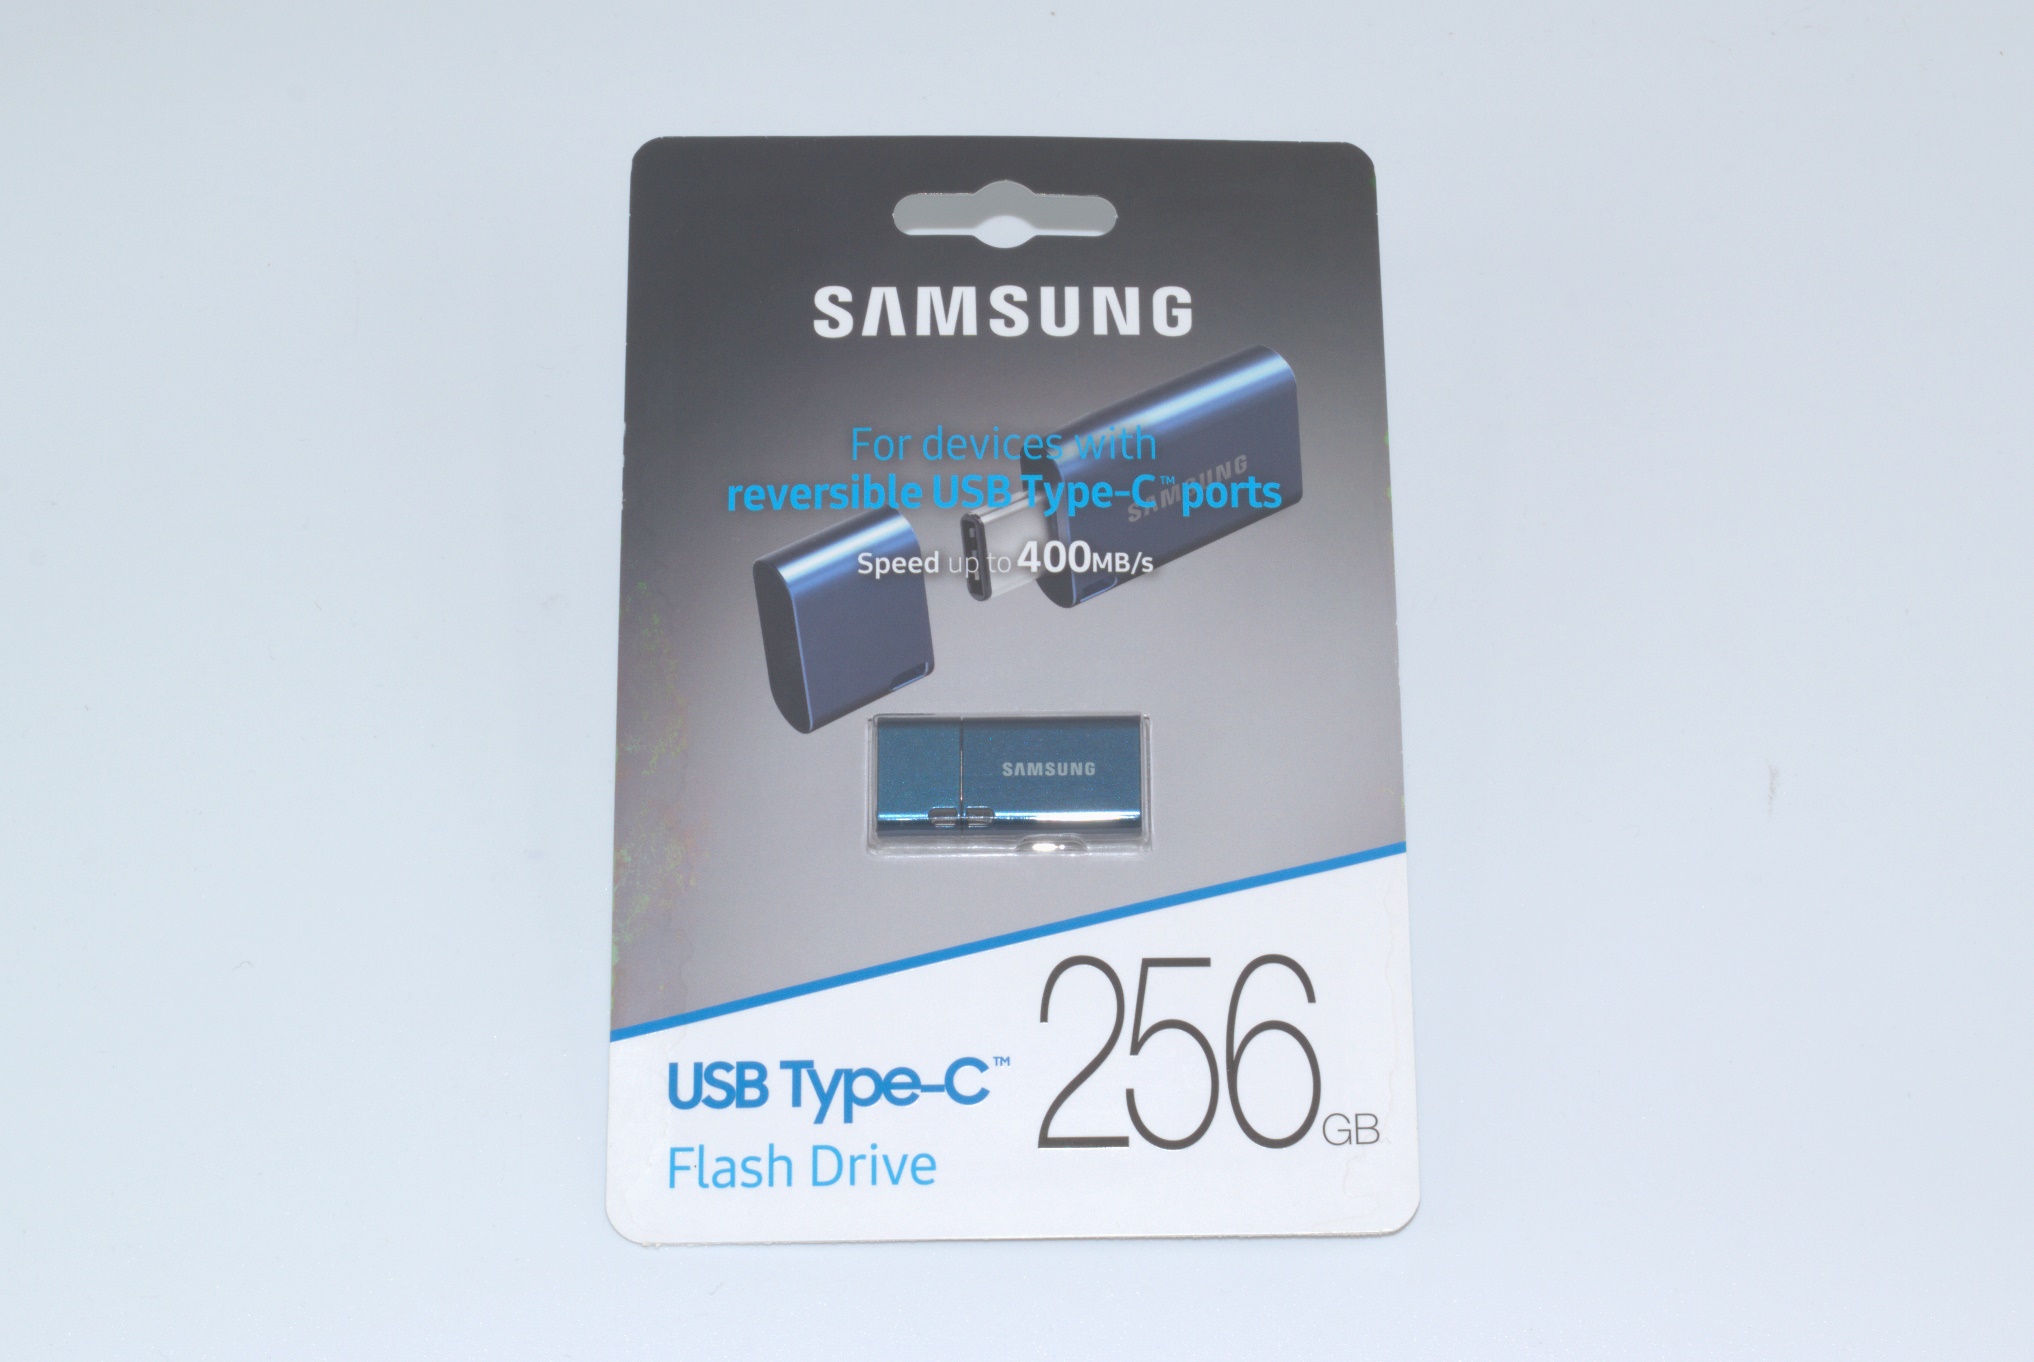
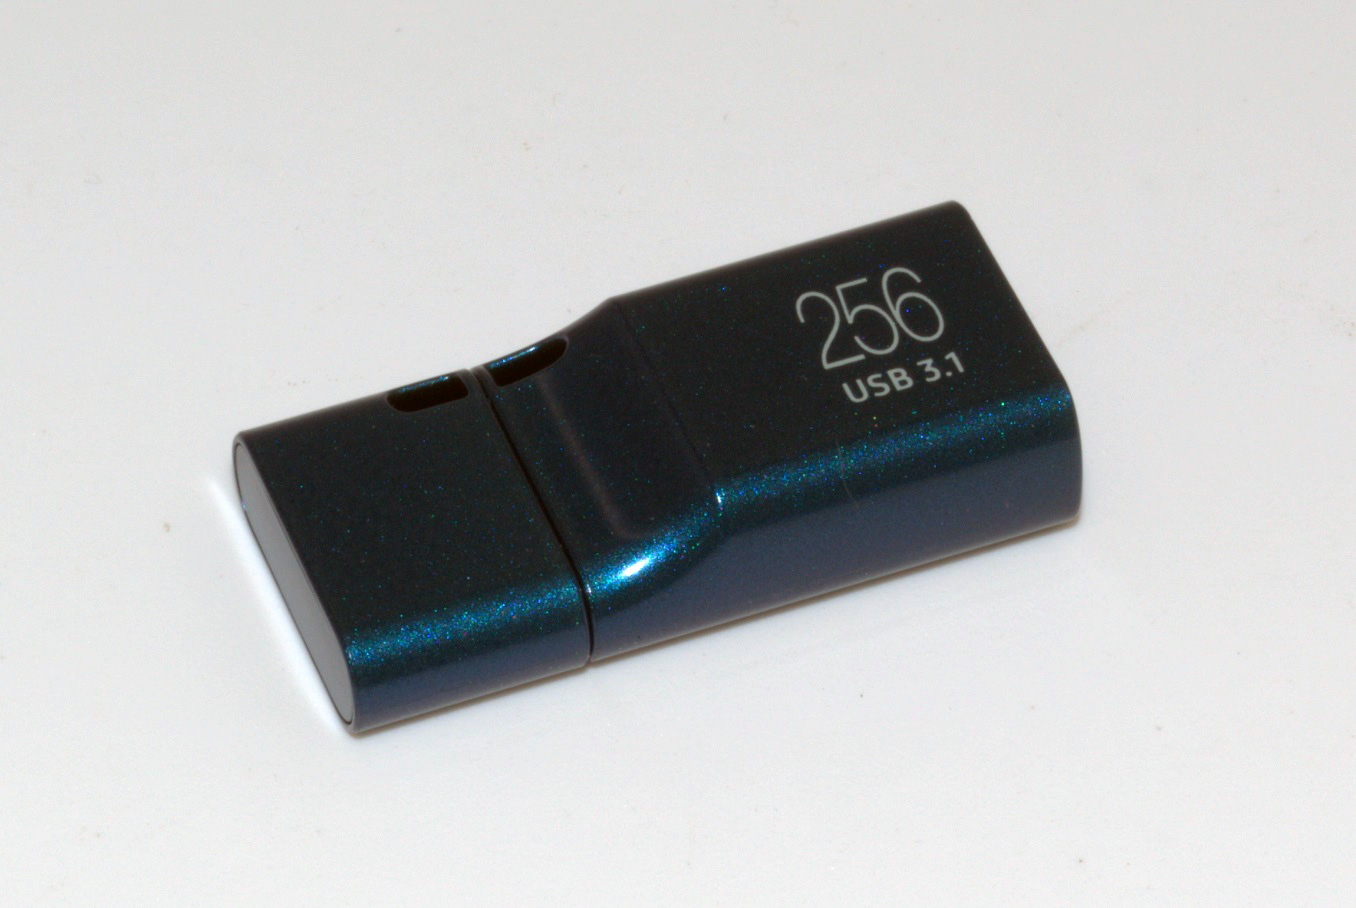
Samsung's MUF-256DA is a compact USB Type-C flash drive (UFD) available in capacities ranging from 64GB to 256GB. It sports a USB 3.2 Gen 1 (5 Gbps) interface. Samsung supplied us with a 256GB version to put through our strenuous review process. The UFD presents itself to the host system as a storage device, but does not support fancy features such as temperature or NAND health reporting. It also doesn't support features such as UASP or TRIM - aspects that are usually absent in compact UFDs.
The ideal comparison products for the MUF-256DA would have been the Mushkin Atom and the Strontium Nitro Plus Nano. However, both of these were reviewed many years back with a now-retired testbed and test suite. While our test suite has retained the same framework, changes in the actual benchmarks mean that we can't compare old results against the ones obtained with our latest testbed and test suite.
| Comparative Direct-Attached Storage Devices Configuration | ||
| Aspect | ||
| Downstream Port | Native Flash | Native Flash |
| Upstream Port | USB 3.2 Gen 1 Type-C | USB 3.2 Gen 2x2 Type-C |
| Bridge Chip | N/A | Silicon Motion SM2320XT |
| Power | Bus Powered | Bus Powered |
| Use Case | Low-power light-weight thumb-sized flash drive, with protection against tough environmental conditions | Low-power 2GBps-class, compact IP55-rated portable SSD |
| Physical Dimensions | 33.7 mm x 15.9 mm x 8.2 mm | 69.54 mm x 32.58 mm x 13.5 mm (without casing) |
| Weight | 3.4 grams | 28.9 grams (without cable and casing) |
| Cable | N/A | 30 cm USB 3.2 Gen 2x2 Type-C to Type-C |
| S.M.A.R.T Passthrough | No | Yes |
| UASP Support | No | Yes |
| TRIM Passthrough | No | Yes |
| Hardware Encryption | N/A | N/A |
| Evaluated Storage | Samsung V-NAND | Micron 96L 3D TLC |
| Price | USD 52 | USD 85 |
| Review Link | Samsung MUF-256DA-AM 256GB Review | Kingston XS2000 500GB Review |
The table above presents a comparative view of the specifications of the different USB flash storage devices presented in this review.
Testbed Setup and Evaluation Methodology
The evaluation routine for direct-attached storage devices - portable SSDs, storage bridges (including RAID enclosures), and memory cards - all utilize the same testbed and have similar workloads with slight tweaks based on the end market for the product. Our testbeds have kept pace with the introduction of new external interfaces - Thunderbolt 2, Thunderbolt 3, and USB 3.2 Gen 2 via Type-C. In mid-2014, we prepared a custom desktop based on Haswell, which was then upgraded to Skylake in early 2016. A botched Thunderbolt 3 firmware upgrade on the Skylake machine meant that we had to shift to the Hades Canyon NUC starting in early 2019. With USB 3.2 Gen 2x2 gaining traction, the inability to use an add-in card in the Hades Canyon NUC meant that we had to go hunting for a new DAS testbed platform.
The 2021 AnandTech DAS Testbed
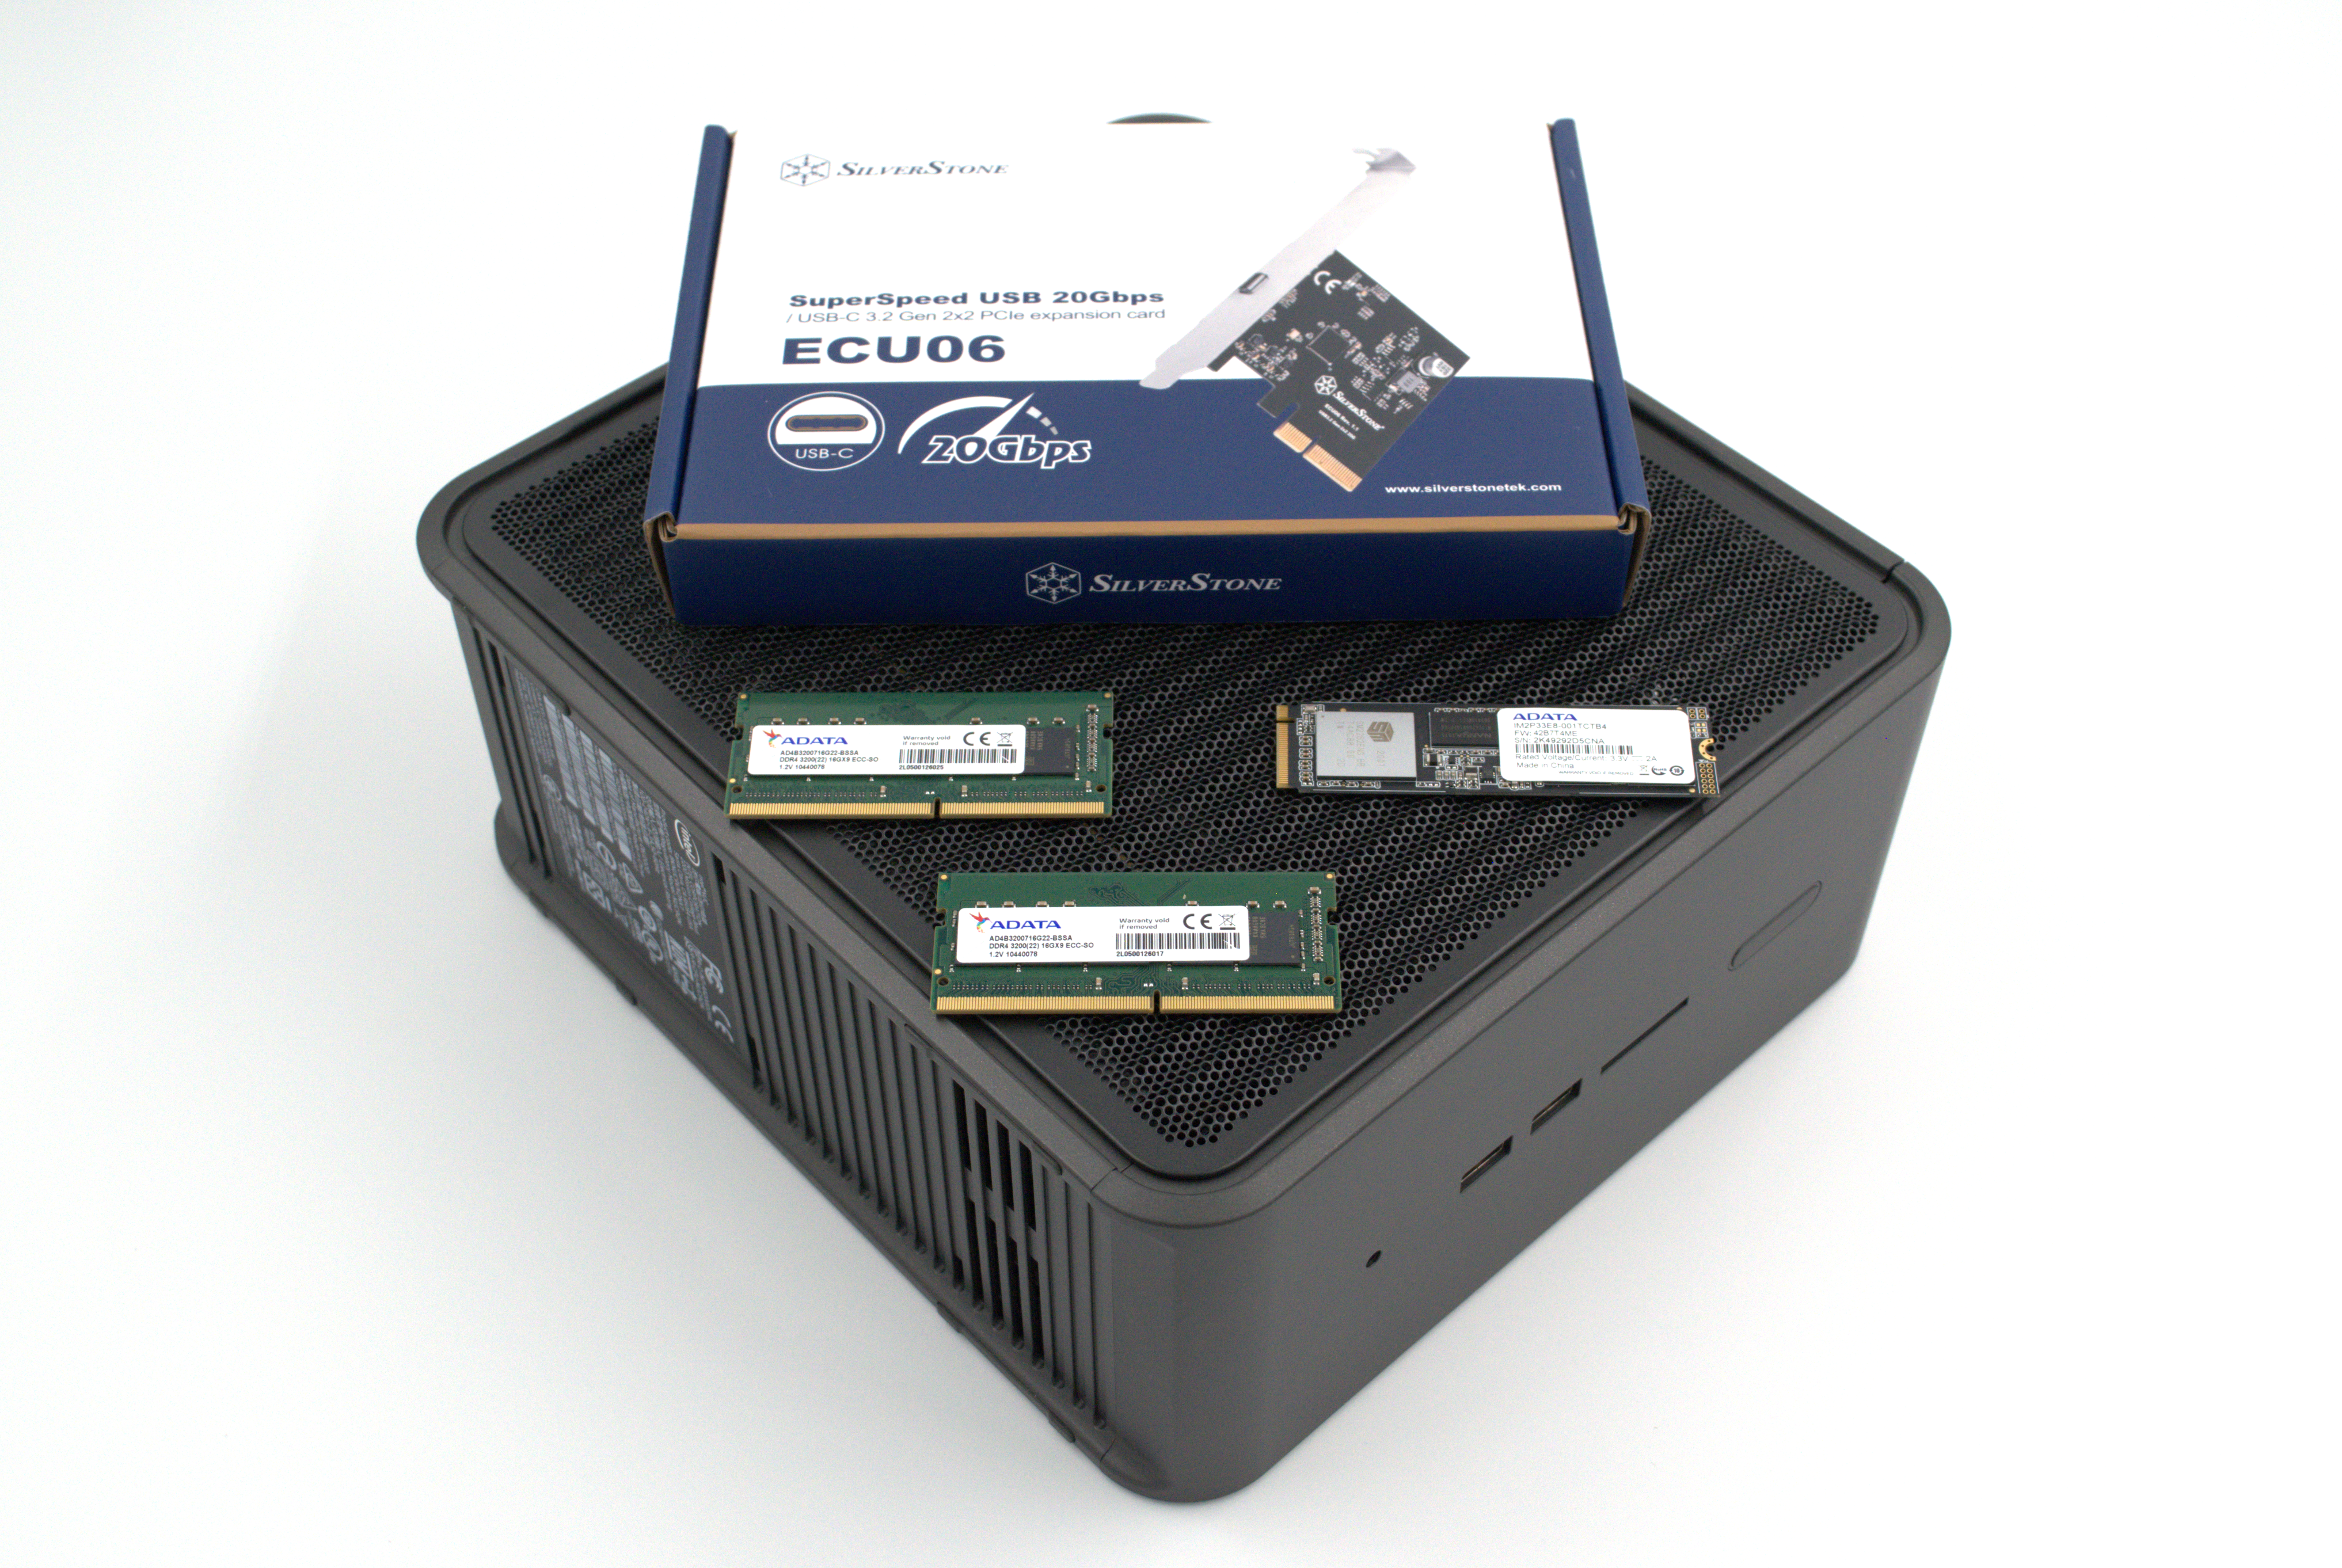
After considering various options in the market, we figured out that the Quartz Canyon NUC (essentially, the Xeon / ECC version of the Ghost Canyon NUC) was a good fit for our requirements. Intel provided us with a sample of the Quartz Canyon NUC, and ADATA helpfully sponsored 2x 16GB DDR4-2667 ECC SODIMMs and a PCIe 3.0 x4 NVMe SSD - the IM2P33E8 1TB.
| AnandTech DAS Testbed Configuration | |
| System | Intel Quartz Canyon NUC9vXQNX |
| CPU | Intel Xeon E-2286M |
| Memory | ADATA Industrial AD4B3200716G22 32 GB (2x 16GB) DDR4-3200 ECC @ 22-22-22-52 |
| OS Drive | ADATA Industrial IM2P33E8 NVMe 1TB |
| Secondary Drive | SanDisk Extreme PRO M.2 NVMe 3D SSD 1TB |
| Add-on Card | SilverStone Tek SST-ECU06 USB 3.2 Gen 2x2 Type-C Host |
| OS | Windows 10 Enterprise x64 (21H1) |
| Thanks to ADATA, Intel, and SilverStone Tek for the build components | |
The specifications of the testbed are summarized in the table above.
The 2021 AnandTech DAS Suite
The testbed hardware is only one segment of the evaluation. Over the last few years, the typical direct-attached storage workloads have also evolved. High bit-rate 4K videos at 60fps have become quite common, and 8K videos are starting to make an appearance. Game install sizes have also grown steadily, thanks to high resolution textures and artwork. Backups tend to involve larger number of files, many of which are small in size. The vendors have also appropriately responded, with 4TB bus-powered units already available in the market. Keeping these in mind, we have adopted some tweaks to our evaluation methodology.
The evaluation scheme for DAS units involves multiple workloads which are described in detail in the corresponding sections.
- Synthetic workloads using CrystalDiskMark and ATTO
- Real-world access traces using PCMark 10's storage benchmark
- Custom robocopy workloads reflective of typical DAS usage
- Sequential write stress test
The new test suite makes the following updates:
- Updated CrystalDiskMark software version to 8.0.2 from 7.0.0
- Increased CrystalDiskMark workload span from 8GiB to 32GiB
- Restructured customm robocopy workloads, with multi-threaded copying enabled
- Temperature tracking enabled during all idling intervals
The major update is in our custom robocopy workloads - the earlier version transferred around 42GB of data back and forth from the DAS over each of three iteration sets for a total of around 250GB of traffic. The new version ups this to around 95GB per iteration direction for a total of around 570GB of traffic.
The robocopy workloads have typically transferred data between the DAS and a RAM drive to remove any bottlenecks from the testbed's storage subsystem. In the new test suite version, we also include a disk-to-disk iteration set where the whole suite (around 318GB) is transferred from the CPU-attached NVMe SSD to the DAS and back. This part of the test is not enabled for storage devices with insufficient capacity (like the Samsung MUF-256DA being reviewed today).
Synthetic Benchmarks - ATTO and CrystalDiskMark
Benchmarks such as ATTO and CrystalDiskMark help provide a quick look at the performance of the direct-attached storage device. The results translate to the instantaneous performance numbers that consumers can expect for specific workloads, but do not account for changes in behavior when the unit is subject to long-term conditioning and/or thermal throttling. Yet another use of these synthetic benchmarks is the ability to gather information regarding support for specific storage device features that affect performance.
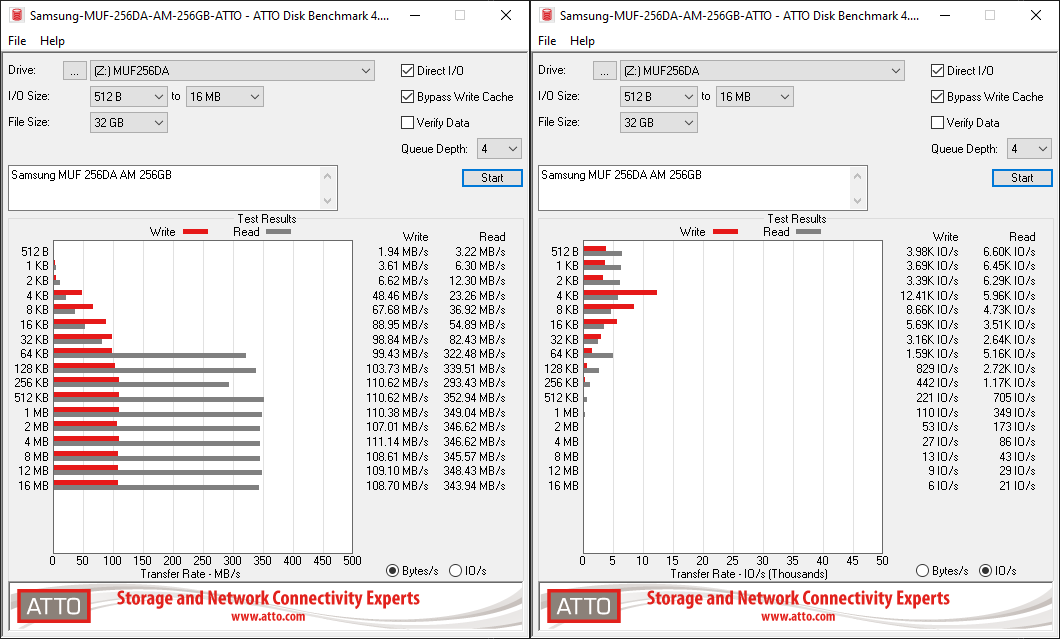
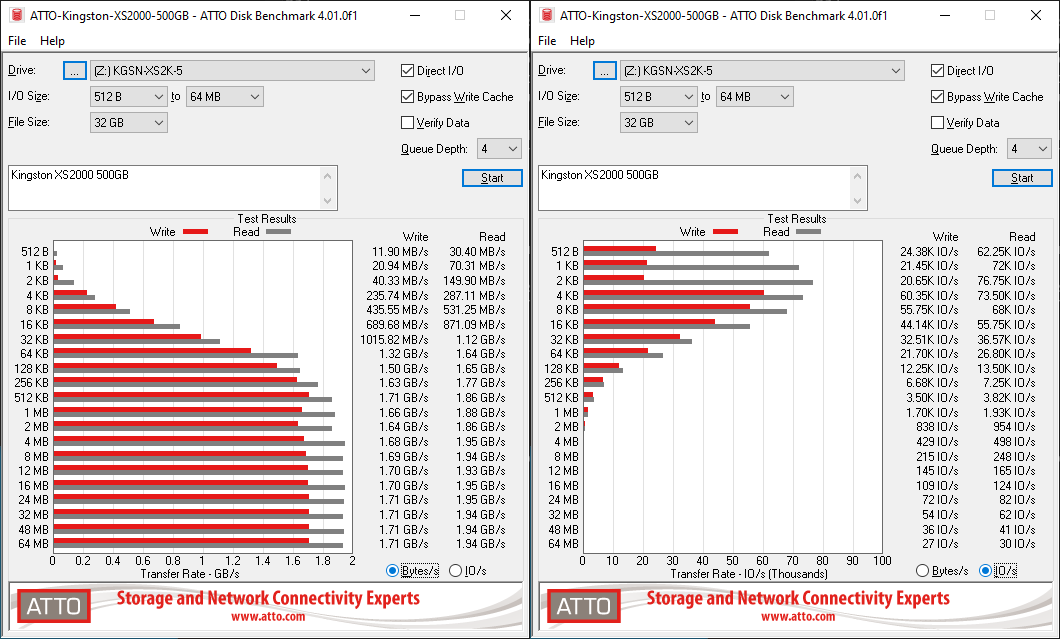
Samsung claims read speeds of up to 400 MBps, but makes no claims about writes except for noting that it is expected to be lower. These are backed up by the ATTO benchmarks provided below. ATTO benchmarking is restricted to a single configuration in terms of queue depth, and is only representative of a small sub-set of real-world workloads. It does allow the visualization of change in transfer rates as the I/O size changes, with optimal performance being reached around 512 KB for a queue depth of 4 - read speeds of around 353 MBps, and writes coming in around 110 MBps.
| ATTO Benchmarks | |
| TOP: | BOTTOM: |
 |
|
 |
|
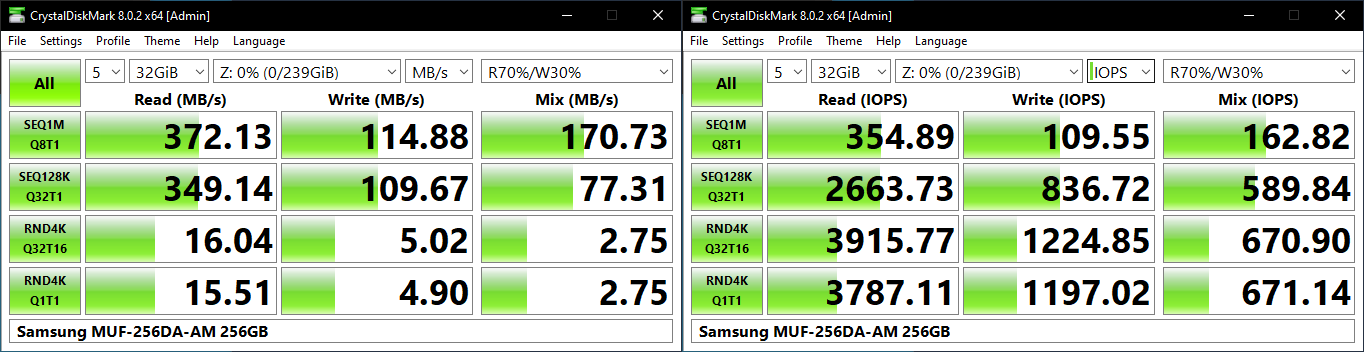
CrystalDiskMark. for example, uses four different access traces for reads and writes over a configurable region size. Two of the traces are sequential accesses, while two are 4K random accesses. Internally, CrystalDiskMark uses the Microsoft DiskSpd storage testing tool. The 'Seq128K Q32T1' sequential traces use 128K block size with a queue depth of 32 from a single thread, while the '4K Q32T16' one does random 4K accesses with the same queue configuration, but from multiple threads. The 'Seq1M' traces use a 1MiB block size. The plain 'Rnd4K' one uses only a single queue and single thread . Comparing the '4K Q32T16' and '4K Q1T1' numbers can quickly tell us whether the storage device supports NCQ (native command queuing) / UASP (USB-attached SCSI protocol). If the numbers for the two access traces are in the same ballpark, NCQ / UASP is not supported. This assumes that the host port / drivers on the PC support UASP.
| CrystalDiskMark Benchmarks | |
| TOP: | BOTTOM: |
 |
|
 |
|
Unfortunately, the Samsung MUF-256DA acts as a vanilla UFD with no support for NCQ or UASP, However, the numbers seen here for each workload is significantly higher than what was seen for the Mushkin Atom or Strontium Nitro Plus Nano. The reads don't quite reach 400 MBps, but writes at 100 MBps+ compare quite favorably against the two thumbnail-sized contenders. While those screenshots are not in the above drop-down, they can be viewed from the linked reviews (the Strontium Nitro Plus Nano comes in at 140 MBps reads / 51 MBps writes and the Mushkin Atom at 191 MBps reads / 26 MBps writes in the best case workloads).
Benchmarking for Performance Consistency
Our testing methodology for storage bridges / direct-attached storage units takes into consideration the usual use-case for such devices. The most common usage scenario is transfer of large amounts of photos and videos to and from the unit. Other usage scenarios include the use of the unit as a download or install location for games and importing files directly from it into a multimedia editing program such as Adobe Photoshop. Some users may even opt to boot an OS off an external storage device.
The AnandTech DAS Suite tackles the first use-case. The evaluation involves processing five different workloads, out of which the first four were processed on the Samsung MUF256-DA:
- AV: Multimedia content with audio and video files totalling 24.03 GB over 1263 files in 109 sub-folders
- Home: Photos and document files totalling 18.86 GB over 7627 files in 382 sub-folders
- BR: Blu-ray folder structure totalling 23.09 GB over 111 files in 10 sub-folders
- ISOs: OS installation files (ISOs) totalling 28.61 GB over 4 files in one folder
- Disk-to-Disk: Addition of 223.32 GB spread over 171 files in 29 sub-folders to the above four workloads (total of 317.91 GB over 9176 files in 535 sub-folders)
Except for the 'Disk-to-Disk' workload, each data set is first placed in a 29GB RAM drive, and a robocopy command is issue to transfer it to the external storage unit (formatted in exFAT for flash-based units such as the Samsung MUF-256DA being reviewed today, and NTFS for HDD-based units).
robocopy /NP /MIR /NFL /J /NDL /MT:32 $SRC_PATH $DEST_PATH
Upon completion of the transfer (write test), the contents from the unit are read back into the RAM drive (read test) after a 10 second idling interval. This process is repeated three times for each workload. Read and write speeds, as well as the time taken to complete each pass are recorded. Whenever possible, the temperature of the external storage device is recorded during the idling intervals - the Samsung MUF-256DA doesn't support temperature read-outs, though. Bandwidth for each data set is computed as the average of all three passes.
The 'Disk-to-Disk' workload involves a similar process, but with one iteration only. The data is copied to the external unit from the CPU-attached NVMe drive, and then copied back to the internal drive. It does include more amount of continuous data transfer in a single direction, as data that doesn't fit in the RAM drive is also part of the workload set. Since this wasn't processed on the MUF-256DA due to capacity issues (needing at least 318GB of free space), the numbers corresponding to those workloads are graphed as 0 below.
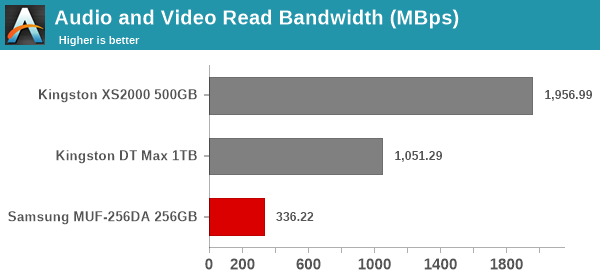
As expected, the UFD doesn't set any performance records, but delivers better results than those in its same size class (Mushkin Atom / Strontium Nitro Plus Nano). We also instrumented our evaluation scheme for determining performance consistency.
Performance Consistency
Aspects influencing the performance consistency include SLC caching and thermal throttling / firmware caps on access rates to avoid overheating. This is important for power users, as the last thing that they want to see when copying over 100s of GB of data is the transfer rate going down to USB 2.0 speeds.
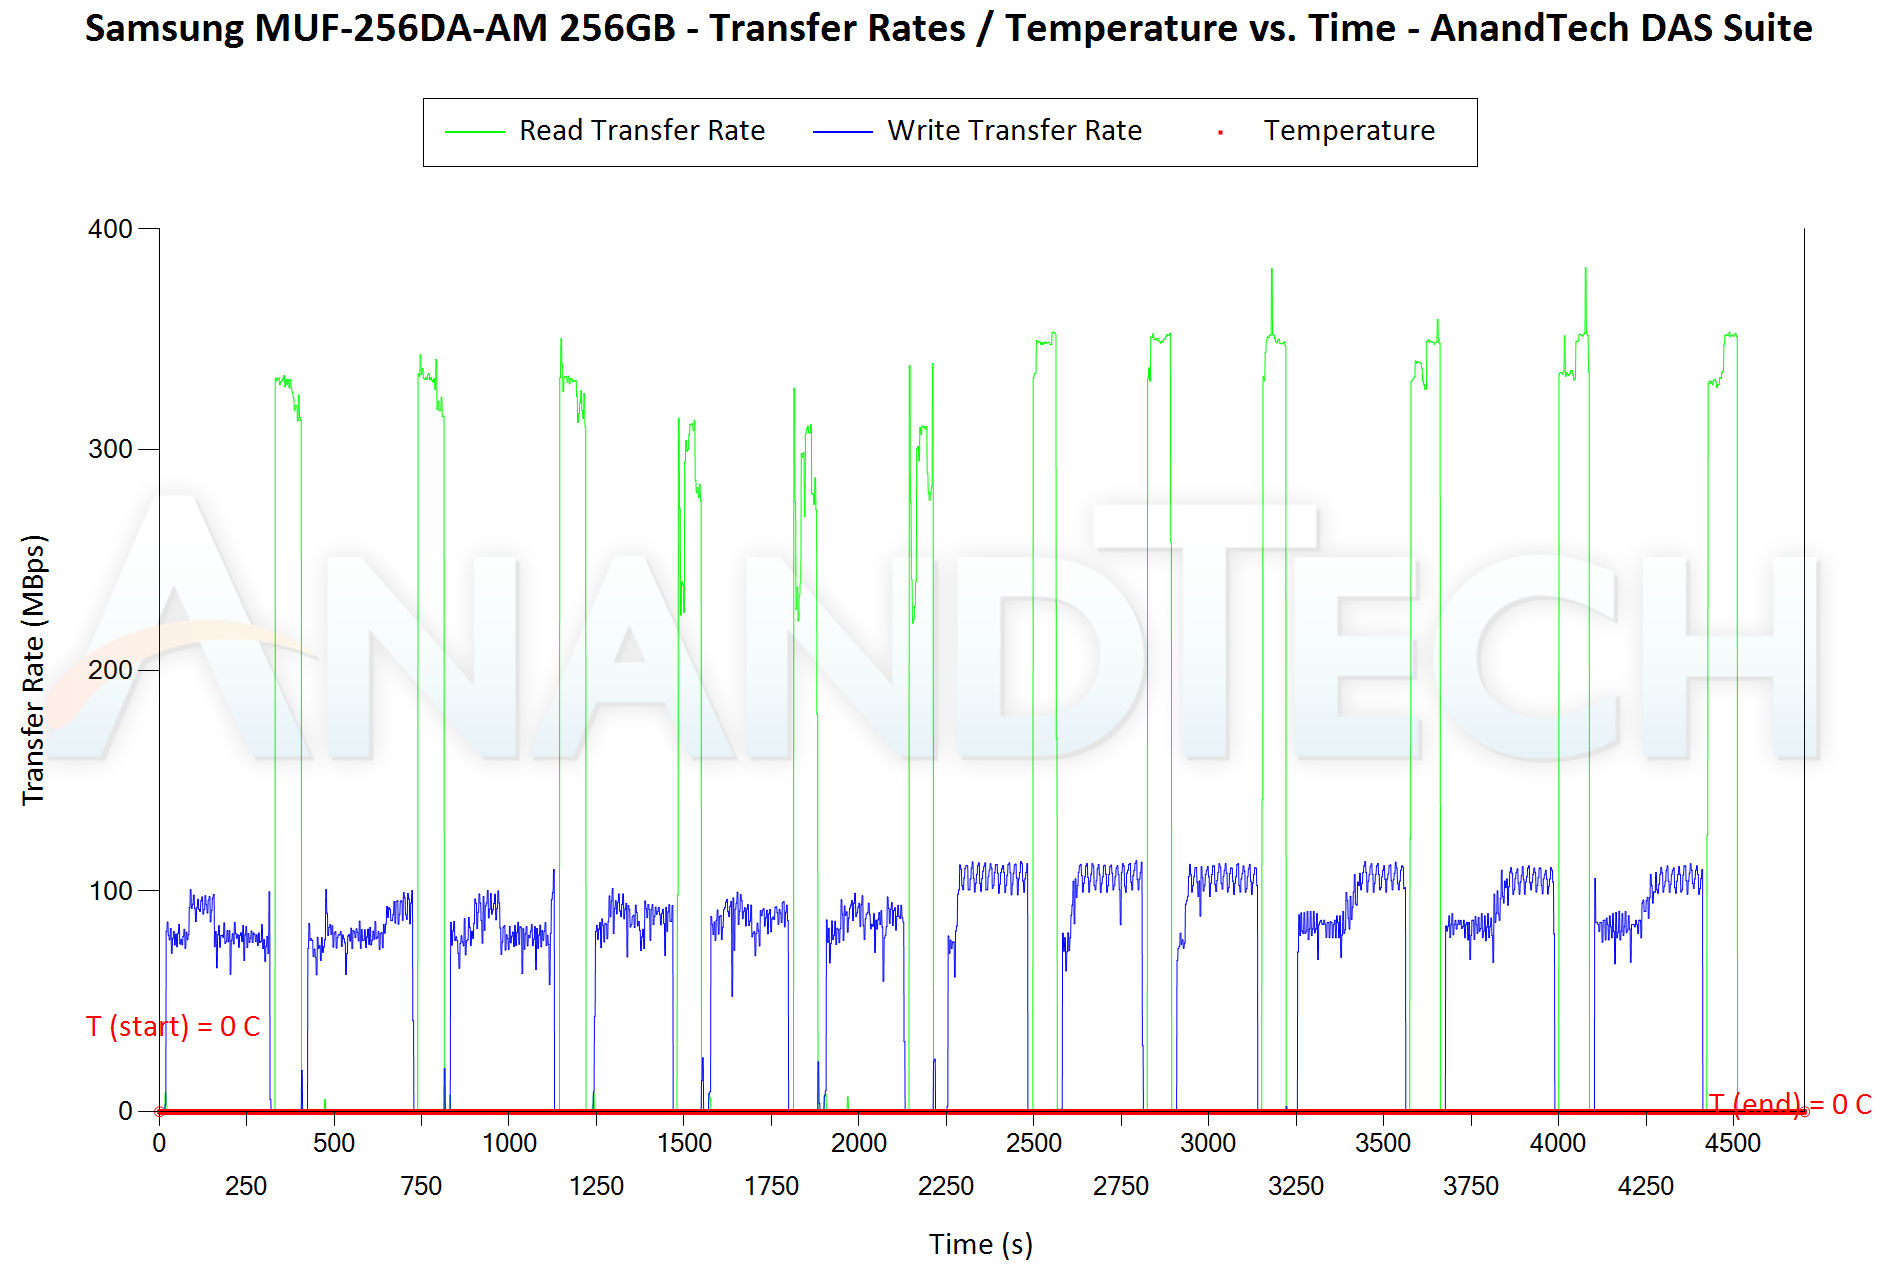
In addition to tracking the instantaneous read and write speeds of the DAS when processing the AnandTech DAS Suite, the temperature of the drive is also recorded during the idling intervals. For units that do not support this, the temperature is recorded as 0. The graphs below present the recorded data.
| AnandTech DAS Suite - Performance Consistency | |
| TOP: | BOTTOM: |
 |
|
 |
|
The first three sets of writes and reads correspond to the AV suite. A small gap (for the transfer of the video suite from the internal SSD to the RAM drive) is followed by three sets for the Home suite. Another small RAM-drive transfer gap is followed by three sets for the Blu-ray folder. This is followed up with the large-sized ISO files set. Finally, we have the single disk-to-disk transfer set. Unlike the comparison products, the Samsung MUF-256DA manages to deliver significant performance consistency. The write speeds are kept close to 100 MBps even for small-sized files.
PCMark 10 Storage Bench - Real-World Access Traces
There are a number of storage benchmarks that can subject a device to artificial access traces by varying the mix of reads and writes, the access block sizes, and the queue depth / number of outstanding data requests. We saw results from two popular ones - ATTO, and CrystalDiskMark - in a previous section. More serious benchmarks, however, actually replicate access traces from real-world workloads to determine the suitability of a particular device for a particular workload. Real-world access traces may be used for simulating the behavior of computing activities that are limited by storage performance. Examples include booting an operating system or loading a particular game from the disk.
PCMark 10's storage bench (introduced in v2.1.2153) includes four storage benchmarks that use relevant real-world traces from popular applications and common tasks to fully test the performance of the latest modern drives:
- The Full System Drive Benchmark uses a wide-ranging set of real-world traces from popular applications and common tasks to fully test the performance of the fastest modern drives. It involves a total of 204 GB of write traffic.
- The Quick System Drive Benchmark is a shorter test with a smaller set of less demanding real-world traces. It subjects the device to 23 GB of writes.
- The Data Drive Benchmark is designed to test drives that are used for storing files rather than applications. These typically include NAS drives, USB sticks, memory cards, and other external storage devices. The device is subjected to 15 GB of writes.
- The Drive Performance Consistency Test is a long-running and extremely demanding test with a heavy, continuous load for expert users. In-depth reporting shows how the performance of the drive varies under different conditions. This writes more than 23 TB of data to the drive.
Despite the data drive benchmark appearing most suitable for testing direct-attached storage, we opt to run the full system drive benchmark as part of our evaluation flow. Many of us use portable flash drives as boot drives and storage for Steam games. These types of use-cases are addressed only in the full system drive benchmark.
The Full System Drive Benchmark comprises of 23 different traces. For the purpose of presenting results, we classify them under five different categories:
- Boot: Replay of storage access trace recorded while booting Windows 10
- Creative: Replay of storage access traces recorded during the start up and usage of Adobe applications such as Acrobat, After Effects, Illustrator, Premiere Pro, Lightroom, and Photoshop.
- Office: Replay of storage access traces recorded during the usage of Microsoft Office applications such as Excel and Powerpoint.
- Gaming: Replay of storage access traces recorded during the start up of games such as Battlefield V, Call of Duty Black Ops 4, and Overwatch.
- File Transfers: Replay of storage access traces (Write-Only, Read-Write, and Read-Only) recorded during the transfer of data such as ISOs and photographs.
PCMark 10 also generates an overall score, bandwidth, and average latency number for quick comparison of different drives. The sub-sections in the rest of the page reference the access traces specified in the PCMark 10 Technical Guide.
Booting Windows 10
The read-write bandwidth recorded for each drive in the boo access trace is presented below.
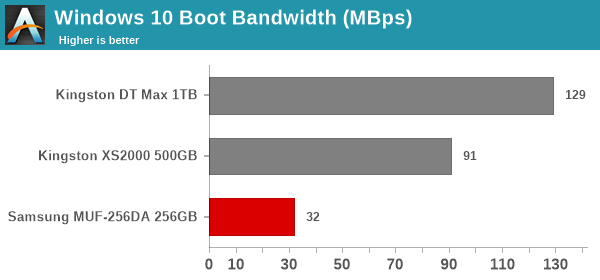
Being limited by the size and interface speed, the Windows 10 booting bandwidth comes to around 30 MBps - definitely better than traditional hard disks, but not good enough to match entry-level portable SSDs.
Creative Workloads
The read-write bandwidth recorded for each drive in the sacr, saft, sill, spre, slig, sps, aft, exc, ill, ind, psh, and psl access traces are presented below.
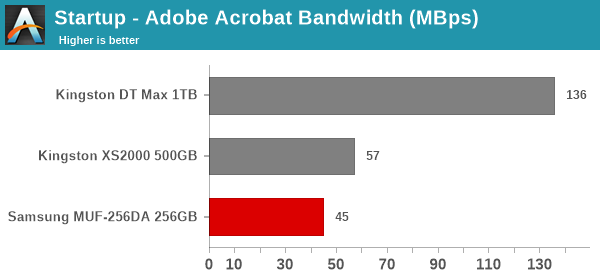
Despite its limited capacity and upstream interface, the bandwidth numbers recorded for the creative workloads almost match the low-end XS2000 portable SSD at the 500GB capacity point. However, it goes without saying that portable SSDs are preferred to UFDs for these kinds of workloads.
Office Workloads
The read-write bandwidth recorded for each drive in the exc and pow access traces are presented below.
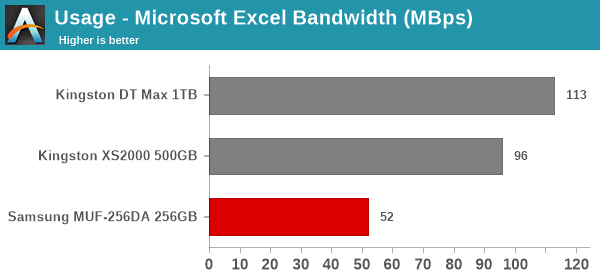
The numbers are not favorable to the UFD, with the pow access trace showing a huge performance deficit compared to the exc workload.
Gaming Workloads
The read-write bandwidth recorded for each drive in the bf, cod, and ow access traces are presented below.
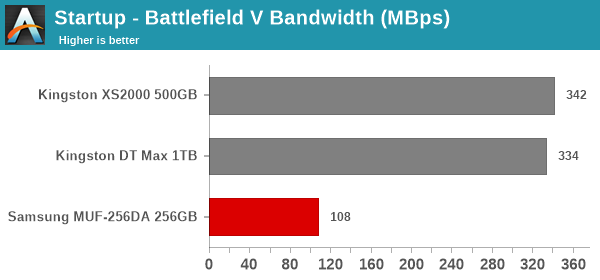
UFDs are ill-suited for loading up games, and the numbers above confirm the same. Even entry-level portable SSDs and high-end thumb drives like the Kingston DT Max can provide 3x to 4x the performance - all at the cost of compactness and price.
Files Transfer Workloads
The read-write bandwidth recorded for each drive in the cp1, cp2, cp3, cps1, cps2, and cps3 access traces are presented below.
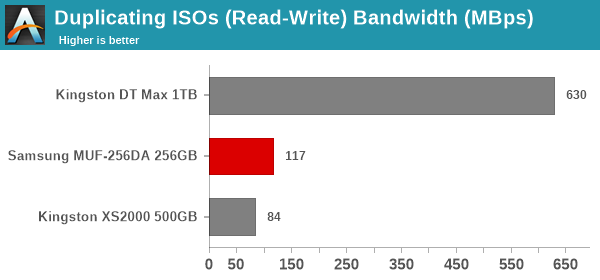
The Files Transfer workloads are where the Samsung MUF-256DA springs a surprise. It often surpasses the 500GB version of the Kingston XS2000 in multiple components. Given the price and size of the UFD, and the fact that these are intended to be the primary use-case for the device, it is commendable.
Overall Scores
PCMark 10 reports an overall score based on the observed bandwidth and access times for the full workload set. The score, bandwidth, and average access latency for each of the drives are presented below.
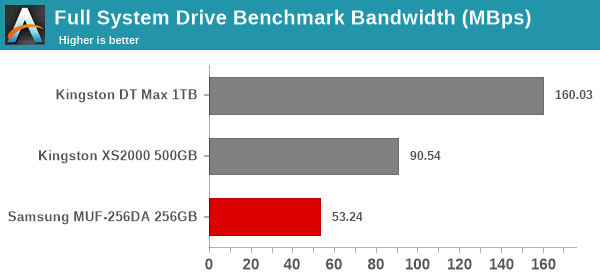
UFDs with native flash controllers and limited channel count are often hampered in terms of ability to deliver high bandwidth and minimize latency. This sub-section showed the Samsung MUF-256DA performing well in its intended use-cases, but the overall score is pulled low due to its behavior in gaming and creative workloads.
Miscellaneous Aspects and Concluding Remarks
The performance of the storage bridges / drives in various real-world access traces as well as synthetic workloads was brought out in the preceding sections. We also looked at the performance consistency for these cases. Power users may also be interested in performance consistency under worst-case conditions, as well as drive power consumption. The latter is also important when used with battery powered devices such as notebooks and smartphones. Pricing is also an important aspect. We analyze each of these in detail below.
Worst-Case Performance Consistency
Flash-based storage devices tend to slow down in unpredictable ways when subject to a large number of small-sized random writes. Many benchmarks use that scheme to pre-condition devices prior to the actual testing in order to get a worst-case representative number. Fortunately, such workloads are uncommon for direct-attached storage devices, where workloads are largely sequential in nature. Use of SLC caching as well as firmware caps to prevent overheating may cause drop in write speeds when a flash-based DAS device is subject to sustained sequential writes.
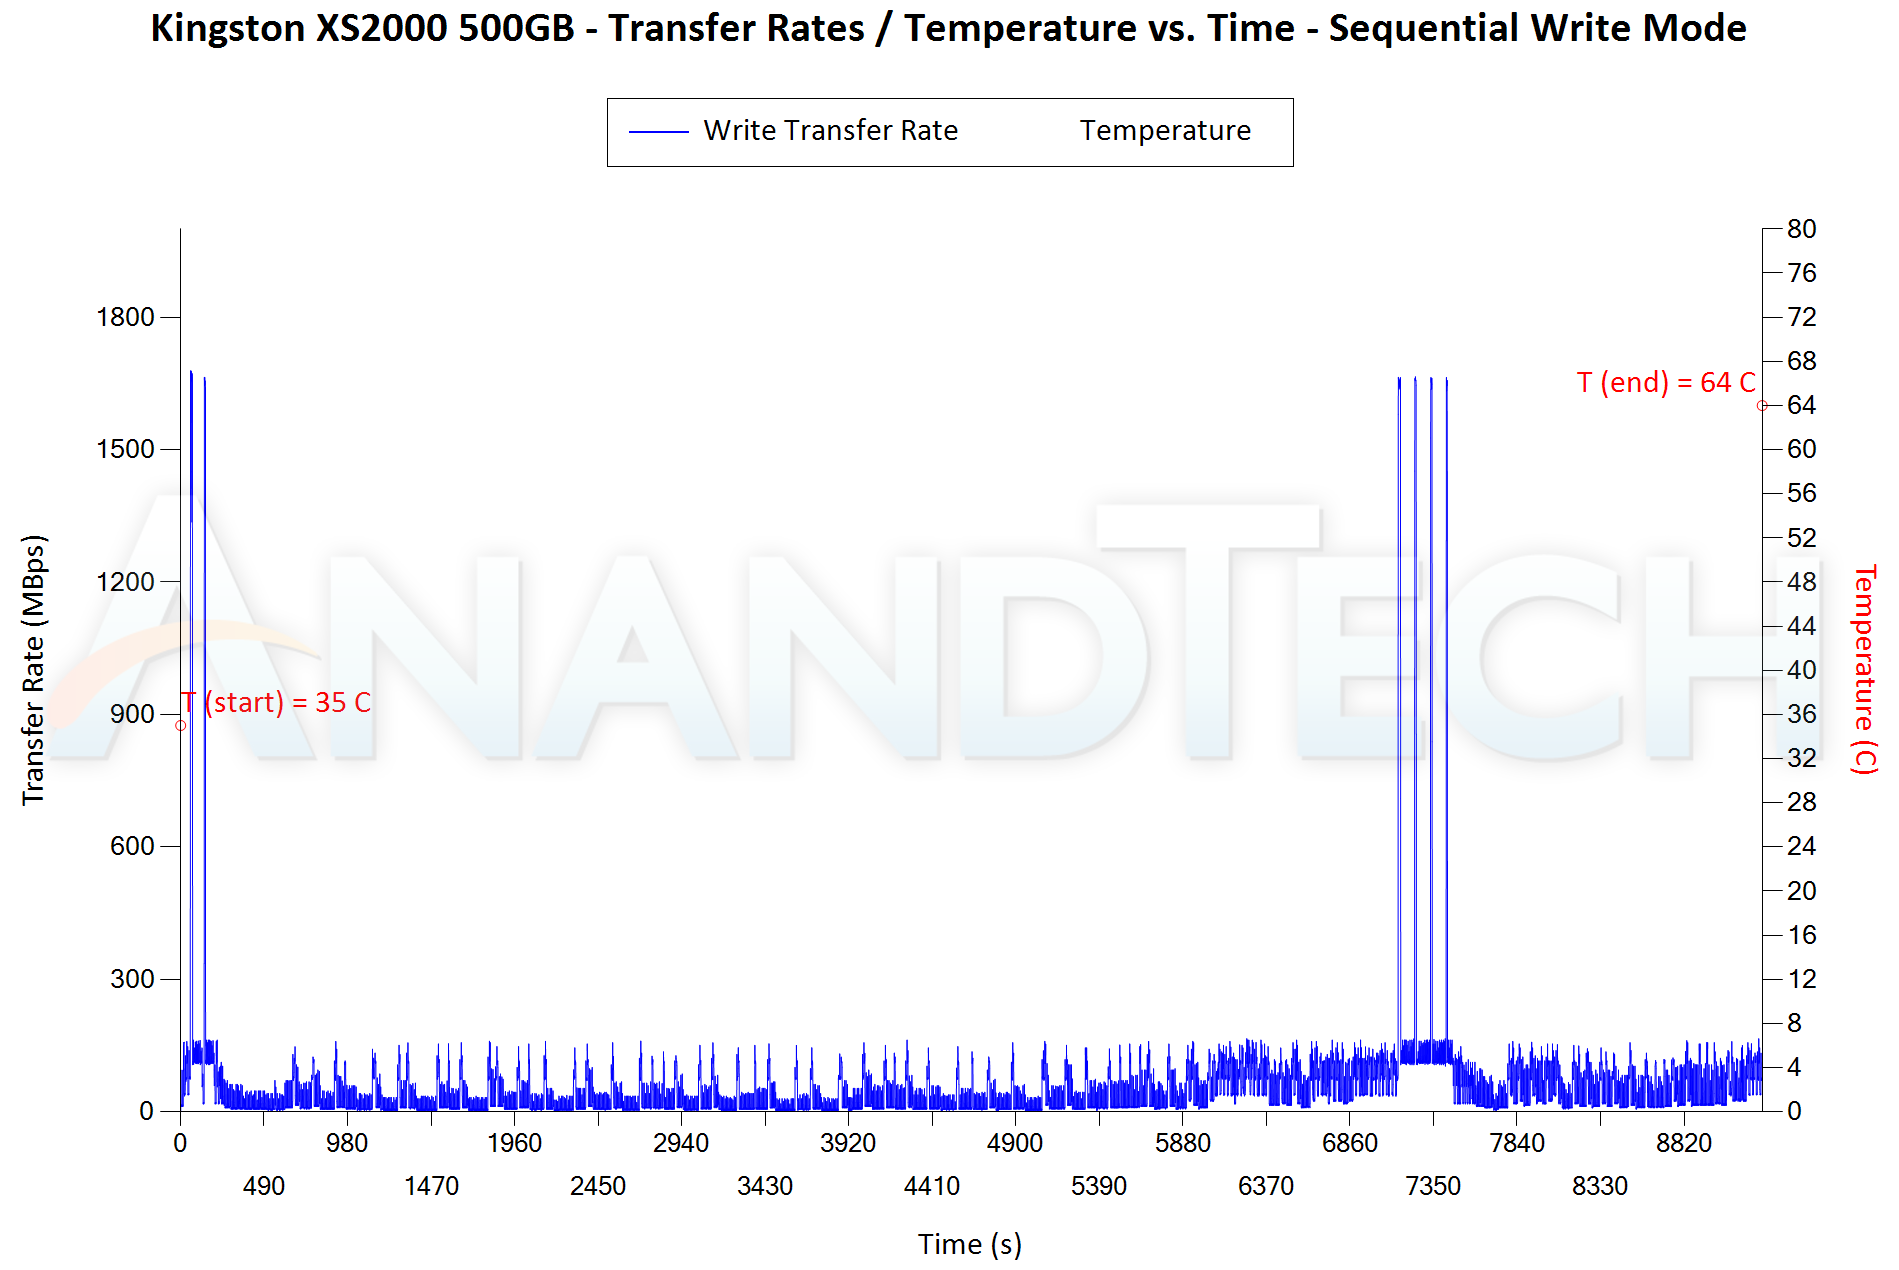
Our Sequential Writes Performance Consistency Test configures the device as a raw physical disk (after deleting configured volumes). A fio workload is set up to write sequential data to the raw drive with a block size of 128K and iodepth of 32 to cover 90% of the drive capacity. The internal temperature is recorded (if supported) at either end of the workload, while the instantaneous write data rate and cumulative total write data amount are recorded at 1-second intervals.
| Sequential Writes to 90% Capacity - Performance Consistency | |
| TOP: | BOTTOM: |
 |
|
 |
|
UFDs and entry-level portable SSDs are often victims of the SLC caching cliff scenario. They start off with high transfer speeds, but drop down to direct-to-TLC speeds after the cache runs out. The problem can be seen in both the Kingston DT Max and XS2000 samples above. Under sustained load, the DT Max 1TB variant drops down to around 50 MBps, while the XS2000 500GB fares slightly worse than that (probably limited by number of parallel flash dice too). Contrast that with the performance of the Samsung MUF-256DA : While the top speed is limited to around 100 MBps, the UFD manages to keep it around that mark through sustained loading for almost the whole capacity of the drive.
Power Consumption
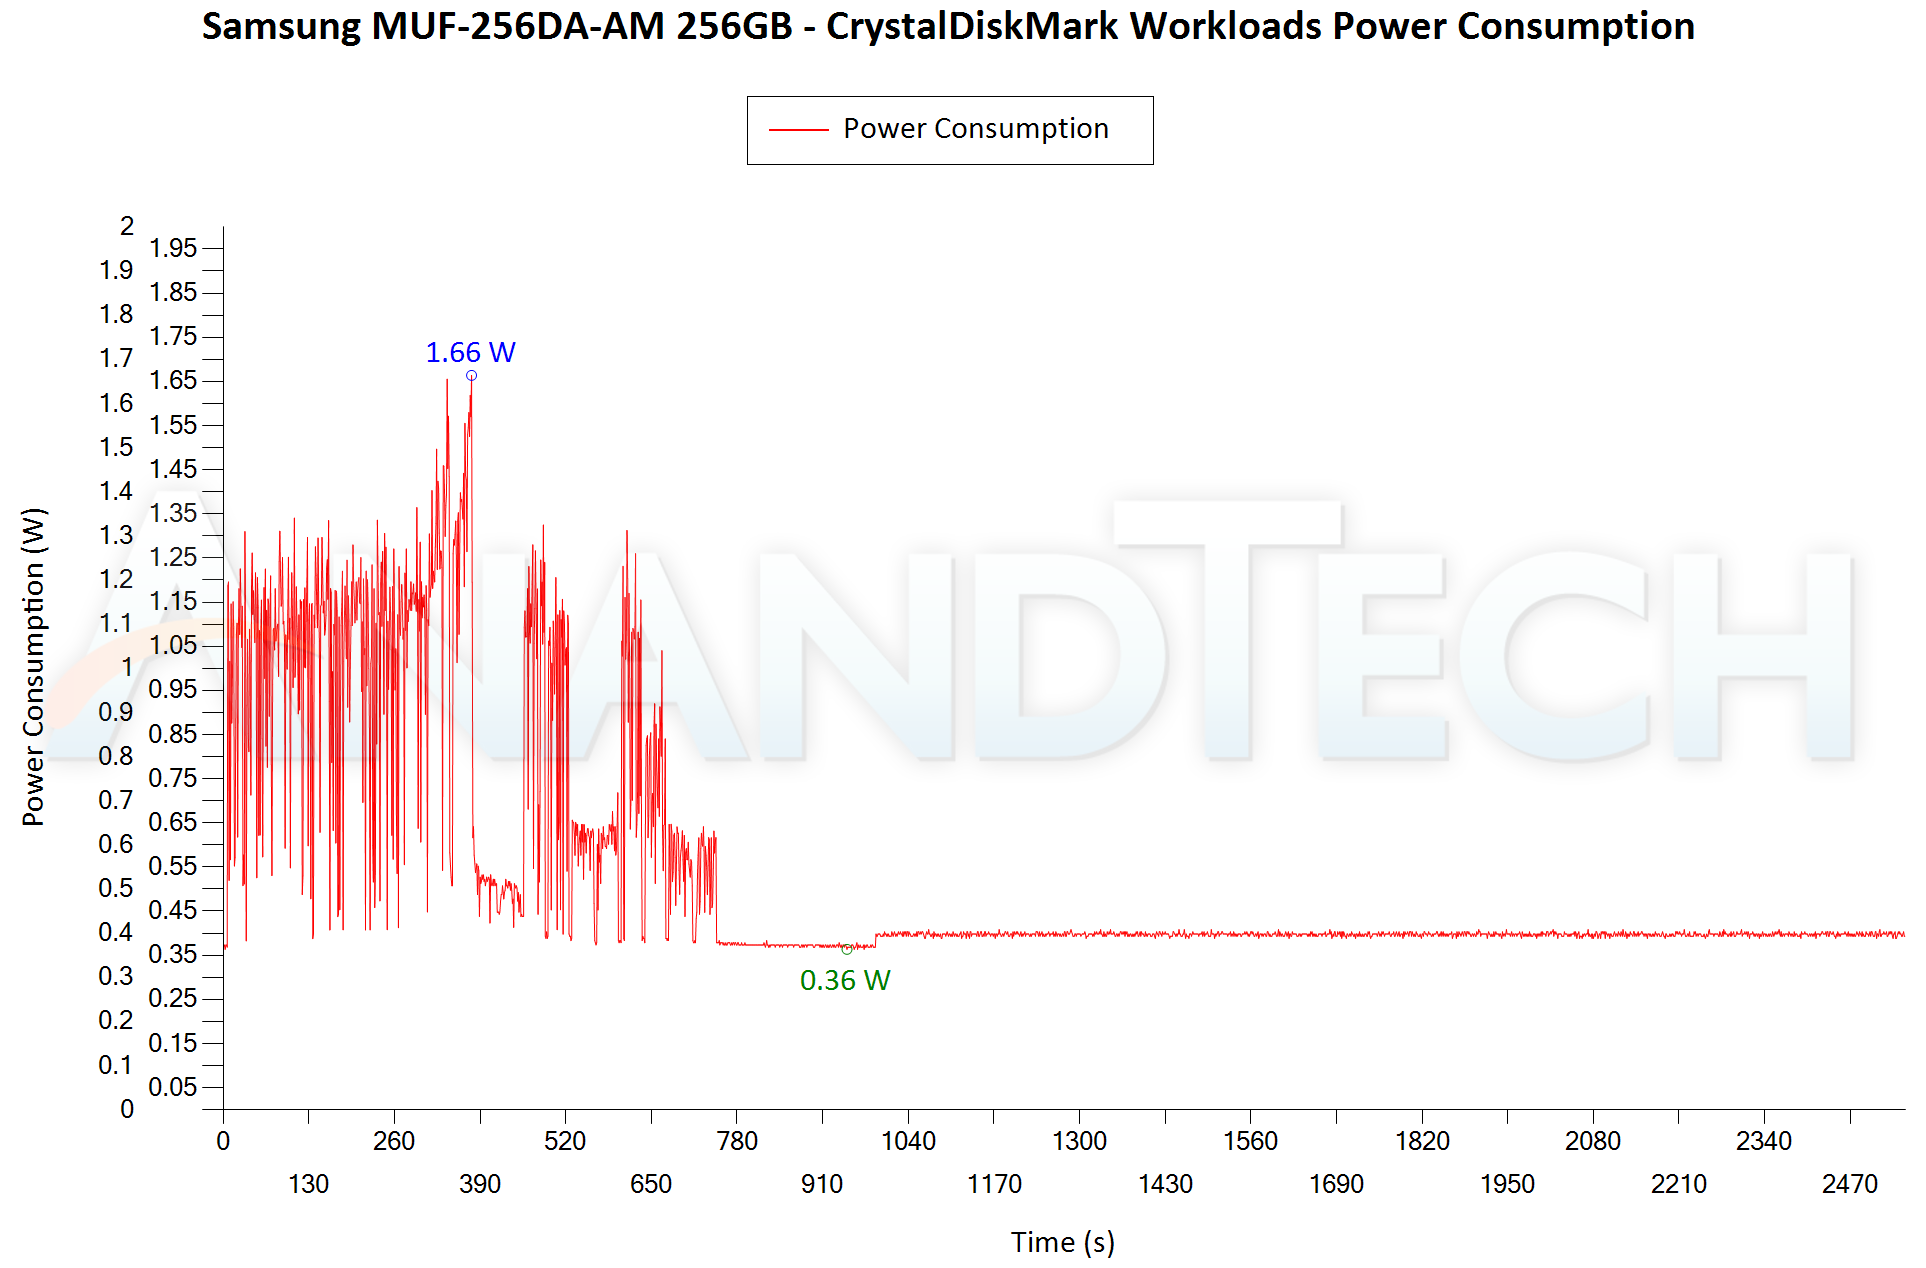
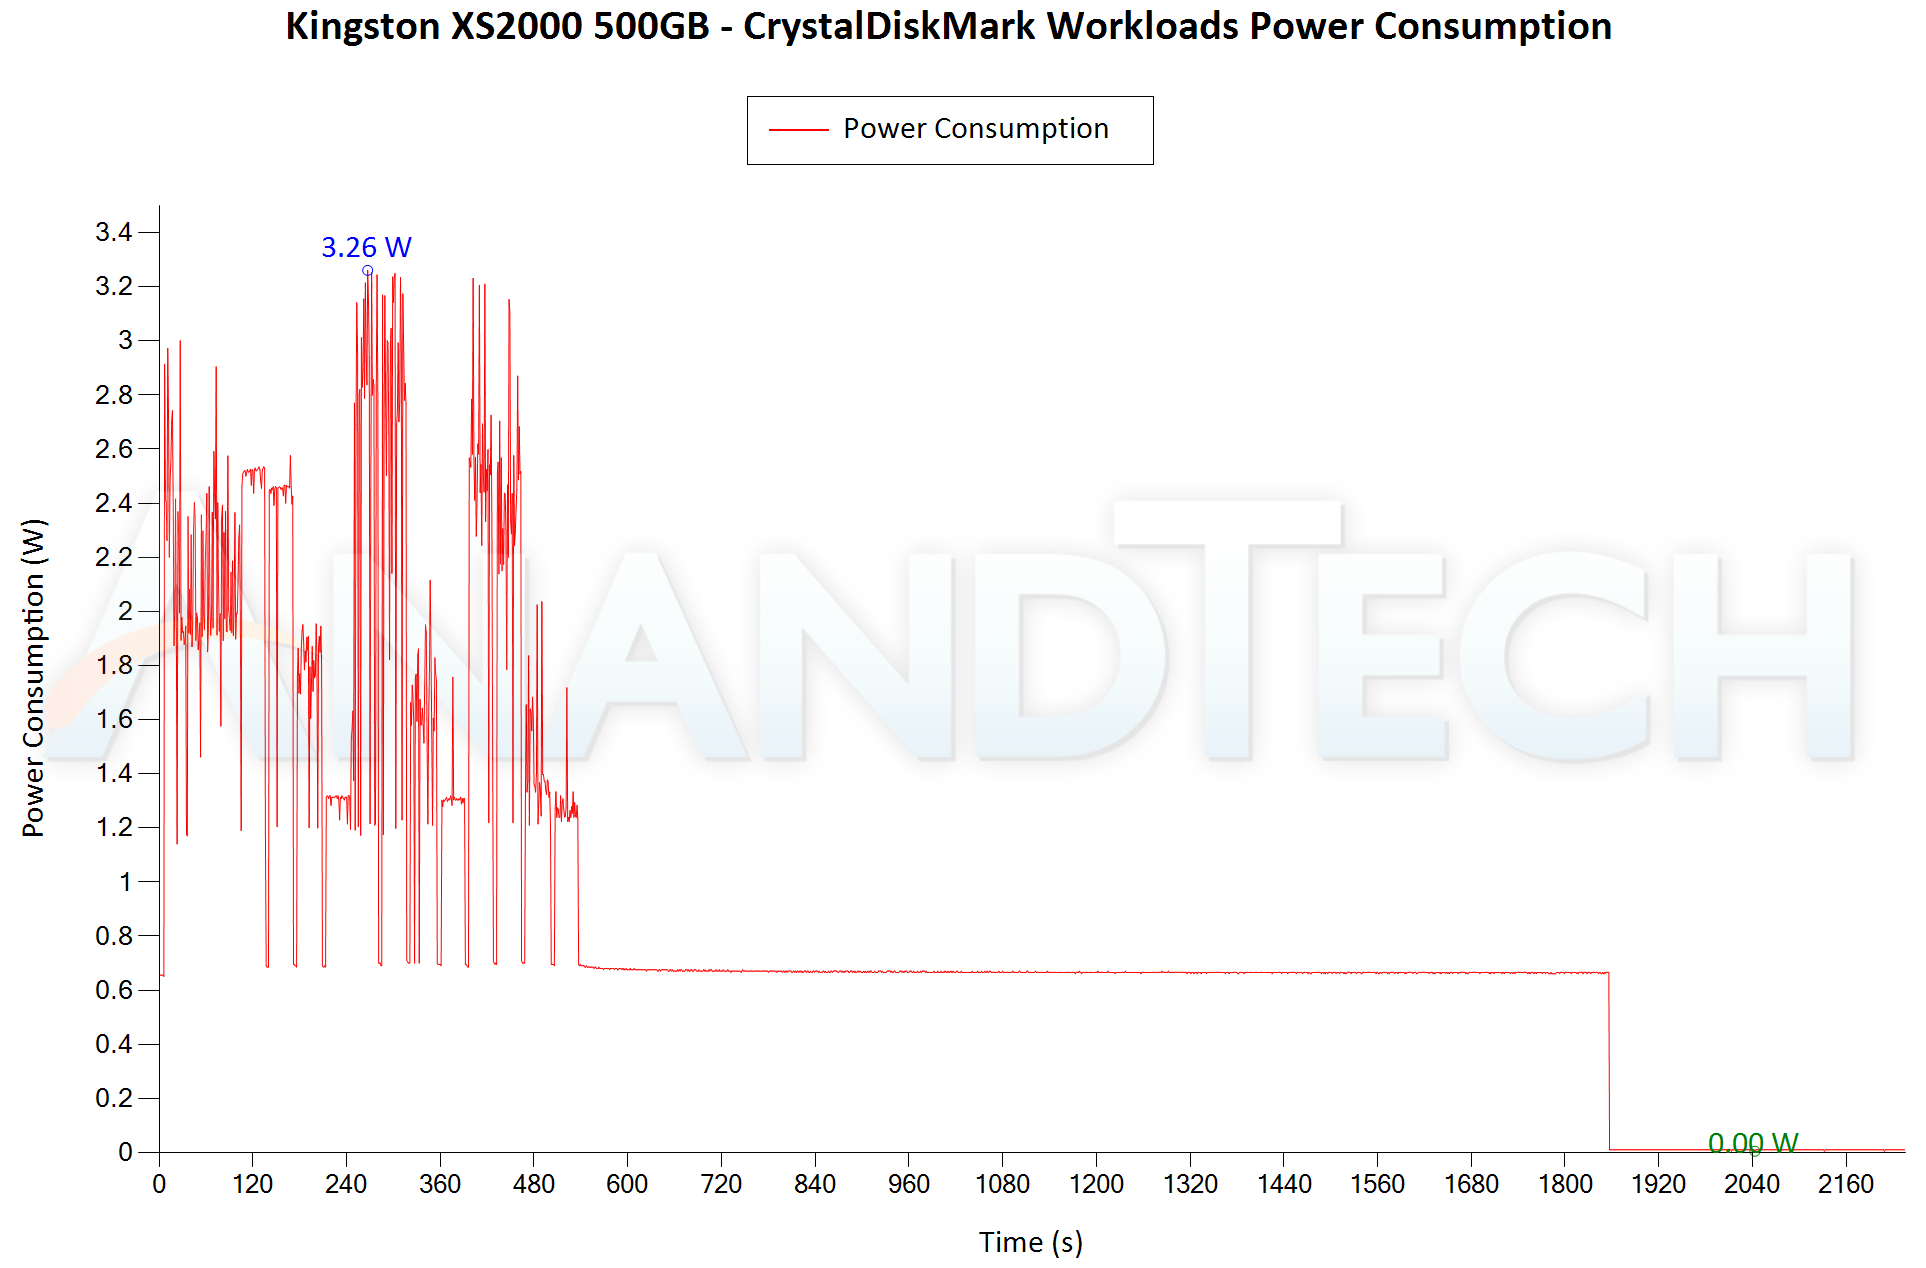
Bus-powered devices can configure themselves to operate within the power delivery constraints of the host port. While Thunderbolt ports are guaranteed to supply up to 15W for client devices, USB 2.0 ports are guaranteed to deliver only 4.5W (900mA @ 5V). In this context, it is interesting to have a fine-grained look at the power consumption profile of the various external drives. Using the Plugable USBC-TKEY, the bus power consumption of the drives was tracked while processing the CrystalDiskMark workloads (separated by 5s intervals). The graphs below plot the instantaneous bus power consumption against time, while singling out the maximum and minimum power consumption numbers.
| CrystalDiskMark Workloads - Power Consumption | |
| TOP: | BOTTOM: |
 |
|
 |
|
The absolute power numbers are the lowest for the Samsung MUF-256DA, as expected (the capacity / number of flash dice is lower, and the speeds are also limited by the USB 3.2 Gen 1 interface). The peak comes in at 1.66W (compared to 3.26W for the XS2000 and 3.05W for the DT Max). However, one aspect we would like to see the MUF-256DA improve upon is the ability to go to a deep sleep state. Both the Kingston drives can drop down to sub-1mW after idling for around 20 minutes, but the Samsung UFD keeps draining around 0.4W throughout.
Concluding Remarks
The rapid advancements in flash technology have made portable SSDs into a huge product category over the last few years. These developments have also not left the ubiquitous UFD (USB flash drive) behind. While native USB 3.2 Gen 2x2 flash controllers have enabled blistering speeds in high-end UFDs such as the Kingston DT Max recently, Samsung's MUF-256DA USB Type-C Flash Drive has also shown that there is a value proposition in delivering a compact UFD that exhibits performance consistency without breaking the bank. To achieve this, Samsung has kept the BOM cost low by going in for the legacy 5 Gbps interface (USB 3.2 Gen 1) and limiting write speeds to around 100 MBps. This has also allowed the thermal design some leeway.
The Samsung MUF series of USB Type-C flash drives comes in three capacities - 64GB (MSRP of $13, street price of $12), 128GB (MSRP of $23, street price of $23), and 256GB (MSRP of $40, street price of $40). The Type-C port and compact nature allow the UFD to be used seamlessly with any modern Type-C-equipped smartphone or tablet supporting OTG storage (allowing the UFD to go into a deep sleep state after a bit of idling would have made it even more attractive). The Kingston DT Max is an alternative with better advertised performance numbers at the 256GB capacity point. However, its build is flimsier and it is not as rugged as the Samsung MUF series when it comes to withstanding wear and tear from frequent use. From a pricing viewpoint, the Kingston DT Max 256GB comes in at $47. For the price premium and the larger physical footprint, the DT Max provides much higher burst performance. However, the Samsung wrests back the advantage in scenarios where performance consistency under sustained load is important. It is rare for a compact UFD to deliver on that premise, but that is exactly what Samsung has done with the solidly-built MUF series.


20 Comments
View All Comments
highlnder69 - Wednesday, July 6, 2022 - link
First two paragraphs are duplicates.ganeshts - Wednesday, July 6, 2022 - link
Thanks for the feedback. It is fixed now.cyrusfox - Wednesday, July 6, 2022 - link
Better performance than flash drives, but performance severely lacking compared to any M.2 enclosure... If size is important this may be the right drive as price is not a deterrent. Usb-c with 350MBs R 100MBs W performance.Golgatha777 - Wednesday, July 6, 2022 - link
Given my phone only has 128GB of storage, I'm too impatient to empty a 128GB SD card, and I'd have to use an adapter to offload from my phone to use a SD card in the first place; this could find a place in my life. It's also super compact, and I like compact and super fast things. However, I have a Samsung T5 2TB drive already, so I'll probably pass.bobg1231 - Wednesday, July 6, 2022 - link
Could you take your test one step further and test speeds transferring to and from an android phone? I have an S22 Ultra and have purchased this drive and only get 45MBs read or write. I can get up to 390MBs with a Samsung portable SSD and can get 75MBs with a SanDisk micro sd. I have tried both the 256 and 128 versions of this drive. Have contacted Samsung and they offer no help or explanation. This is driving me nuts!!lmcd - Wednesday, July 6, 2022 - link
Sometimes the OTG mode is only advertised as USB 2 even when the client mode is USB 3. It would be weird, but the 45 MBps is awful close to expected USB 2 bandwidth.meacupla - Wednesday, July 6, 2022 - link
That sounds more like a phone design problem, rather than a problem with this drive.bobg1231 - Wednesday, July 6, 2022 - link
That's what I would have thought, and I'm sure it is somehow(funny that it's the latest greatest Samsung phone not playing well with a Samsung drive) But why does a lower rated SanDisk micro sd perform so much better?bobg1231 - Thursday, July 7, 2022 - link
I agree on the phone being the issue. However it just seems odd that Samsung's latest greatest flagship phone won't play well with their own flash drive. I have a micro sd card with usb c adapter that will transfer at 75MBs.philehidiot - Wednesday, July 6, 2022 - link
I use one of these for using TAILS. It's not bad at all for that purpose, but the priority there is obviously not speed, but it's definitely good enough.I'm probably on another list now.