The AMD Ryzen 9 7900, Ryzen 7 7700, and Ryzen 5 7600 Review: Zen 4 Efficiency at 65 Watts
by Gavin Bonshor on January 9, 2023 9:00 AM ESTCPU Benchmark Performance: Simulation
Simulation and Science have a lot of overlap in the benchmarking world. The benchmarks that fall under Science have a distinct use for the data they output – in our Simulation section, these act more like synthetics but at some level are still trying to simulate a given environment.
In the encrypt/decrypt scenario, how data is transferred and by what mechanism is pertinent to on-the-fly encryption of sensitive data - a process by which more modern devices are leaning to for software security.
We are using DDR5 memory on the 12th and 13th Gen Core parts, as well as the Ryzen 7000 series, at the following settings:
- DDR5-5600B CL46 - Intel 13th Gen
- DDR5-5200 CL44 - Ryzen 7000
- DDR5-4800 (B) CL40 - Intel 12th Gen
All other CPUs such as Ryzen 5000 and 3000 were tested at the relevant JEDEC settings as per the processor's individual memory support with DDR4.
Simulation
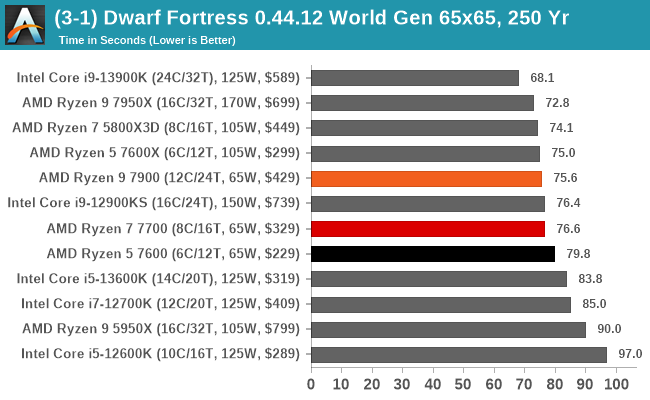
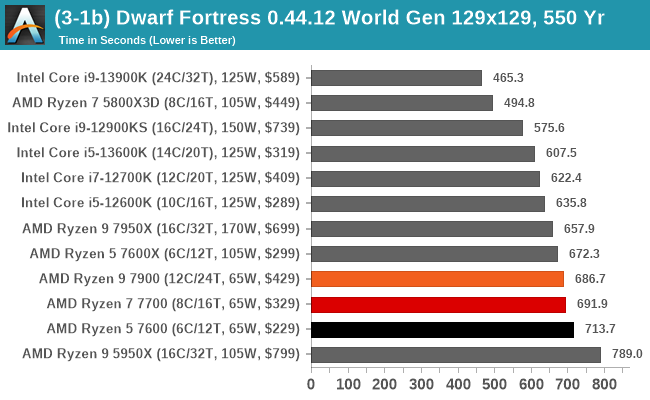
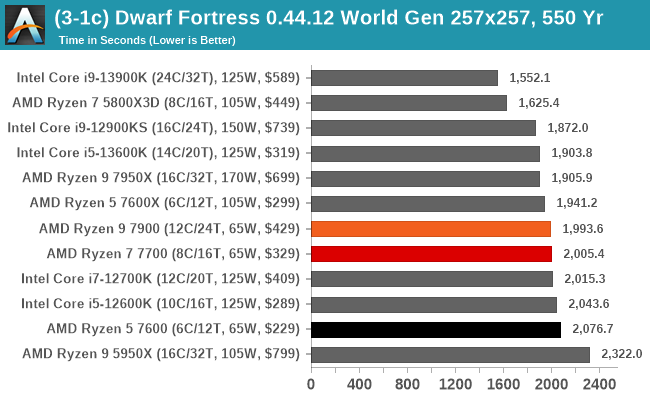
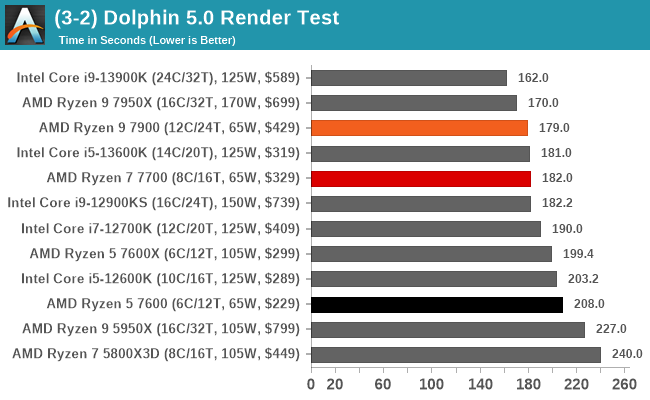
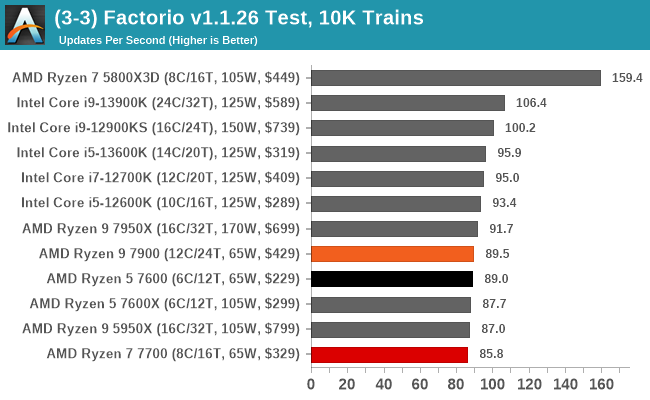
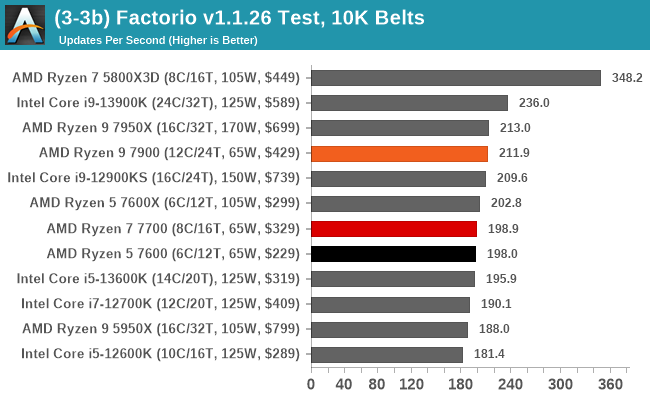
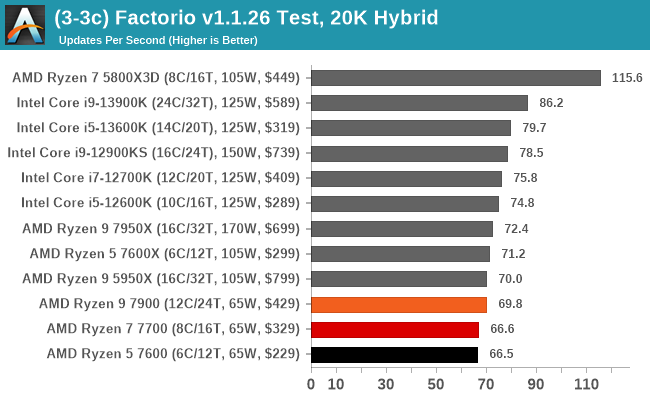
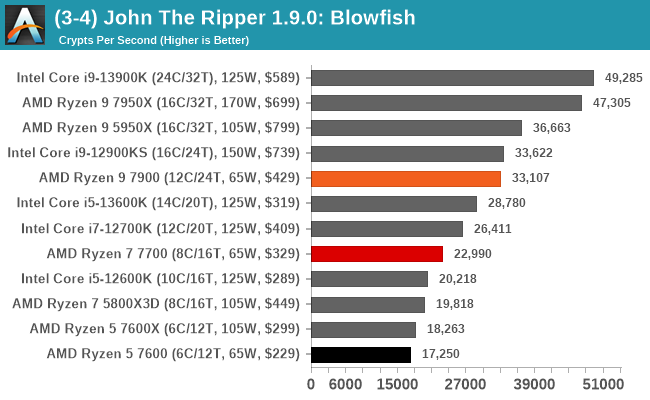
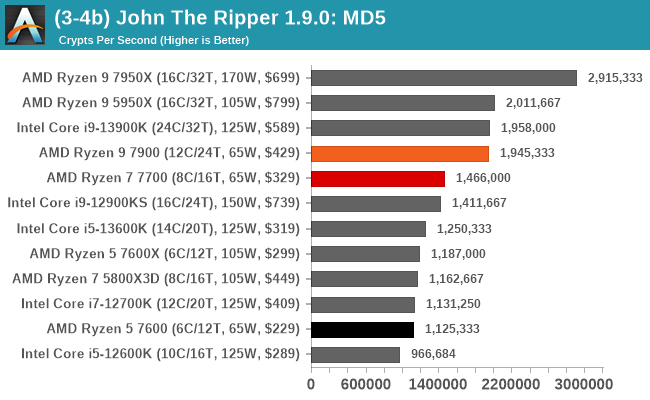
In our simulation-based tests, the AMD Ryzen 7000 65 W SKUs start to break away from each other as single-core IPC performance isn't as crucial as multi-threaded performance in some cases.
The 65 W implementation on the 6C/12 Ryzen 5 7600 starts to show its limitations as a hex-core part, with the Ryzen 9 7900 (12C/24T) performing above our expectations in the majority of our simulation tests.
As expected, the Ryzen 7 7700 (8C/16T) sits in the middle of the three Ryzen 7000 65 W series processors in regards to performance, but it also sits in the middle in terms of specifications, core count, and pricing.


55 Comments
View All Comments
iRacer - Wednesday, February 1, 2023 - link
How do you get V-Ray benchmark values which are 35 to 50% higher than anything that can be seen on the results page?What version of the benchmark are you using?
leavenfish - Sunday, February 5, 2023 - link
Ummm....don't think he ever did the testing update he said he would try to do (but was busy) the weekened after the article came out?Gavin Bonshor - Monday, February 6, 2023 - link
It's coming, don't worry.Gavin Bonshor - Monday, February 6, 2023 - link
It isn't the latest iteration. It's the previous version (4). The critical area to consider is the consistency of the results within the same version.Of course, we will update this benchmark in our next wave to the latest version. If we did this for every benchmark, I would spend 100% of my time testing and 0% writing.
blueryu - Tuesday, February 7, 2023 - link
I'd like to know the idle power consumption of the CPUs. Apparently there is quite a difference at idle between the latest AMD and Intel options but can't seem to find much in the way of tests.