The AMD Ryzen 9 7950X3D Review: AMD's Fastest Gaming Processor
by Gavin Bonshor on February 27, 2023 9:00 AM ESTCPU Benchmark Performance: Power And Office
Our previous sets of ‘office’ benchmarks have often been a mix of science and synthetics, so this time we wanted to keep our office section purely on real-world performance. We've also incorporated our power testing into this section too.
The biggest update to our Office-focused tests for 2023 and beyond include UL's Procyon software, which is the successor to PCMark. Procyon benchmarks office performance using Microsoft Office applications, as well as Adobe's Photoshop/Lightroom photo editing software, and Adobe Premier Pro's video editing capabilities. Due to issues with UL Procyon and the video editing test, we haven't been able to properly run these, but once we identify a fix with UL, we will re-test each chip.
We are using DDR5 memory on the Ryzen 9 7950X3D and the other Ryzen 7000 series we've tested. This also includes Intel's 13th and 12th Gen processors. We tested the aforementioned platforms with the following settings:
- DDR5-5600B CL46 - Intel 13th Gen
- DDR5-5200 CL44 - Ryzen 7000
- DDR5-4800 (B) CL40 - Intel 12th Gen
All other CPUs such as Ryzen 5000 and 3000 were tested at the relevant JEDEC settings as per the processor's individual memory support with DDR4.
Power
The nature of reporting processor power consumption has become, in part, a bit of a nightmare. Historically the peak power consumption of a processor, as purchased, is given by its Thermal Design Power (TDP, or PL1). For many markets, such as embedded processors, that value of TDP still signifies the peak power consumption. For the processors we test at AnandTech, either desktop, notebook, or enterprise, this is not always the case.
Modern high-performance processors implement a feature called Turbo. This allows, usually for a limited time, a processor to go beyond its rated frequency. Exactly how far the processor goes depends on a few factors, such as the Turbo Power Limit (PL2), whether the peak frequency is hard coded, the thermals, and the power delivery. Turbo can sometimes be very aggressive, allowing power values 2.5x above the rated TDP.
AMD and Intel have different definitions for TDP that are, broadly speaking, applied the same. The difference comes from turbo modes, turbo limits, turbo budgets, and how the processors manage that power balance. These topics are 10000-12000 word articles in their own right, and we’ve got a few articles worth reading on the topic.
- Why Intel Processors Draw More Power Than Expected: TDP and Turbo Explained
- Talking TDP, Turbo and Overclocking: An Interview with Intel Fellow Guy Therien
- Reaching for Turbo: Aligning Perception with AMD’s Frequency Metrics
- Intel’s TDP Shenanigans Hurts Everyone
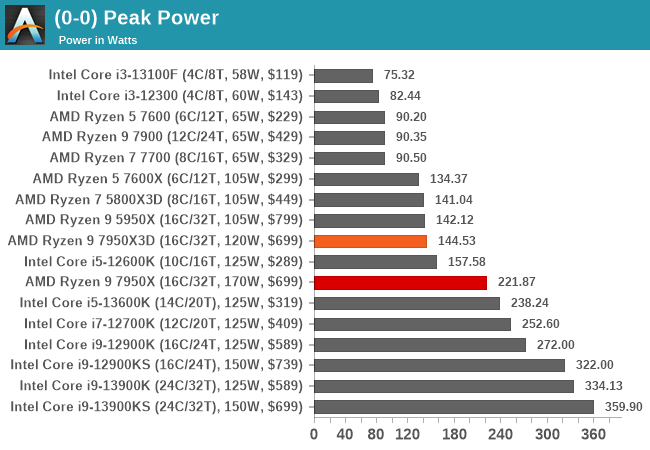
Given that the Ryzen 9 7950X3D has a lower TDP and PPT rating than the Ryzen 9 7950X, it pulls less power. We observed a peak power output of 144.53 W on the 7950X3D, compared to 221.87 W on the 7950X. Talking figures, the Ryzen 7950X3D is pulling around 65% of the power of the 7950X, which is understandable given the power limitations due to the CCX laden with AMD's 3D V-Cache packaging.
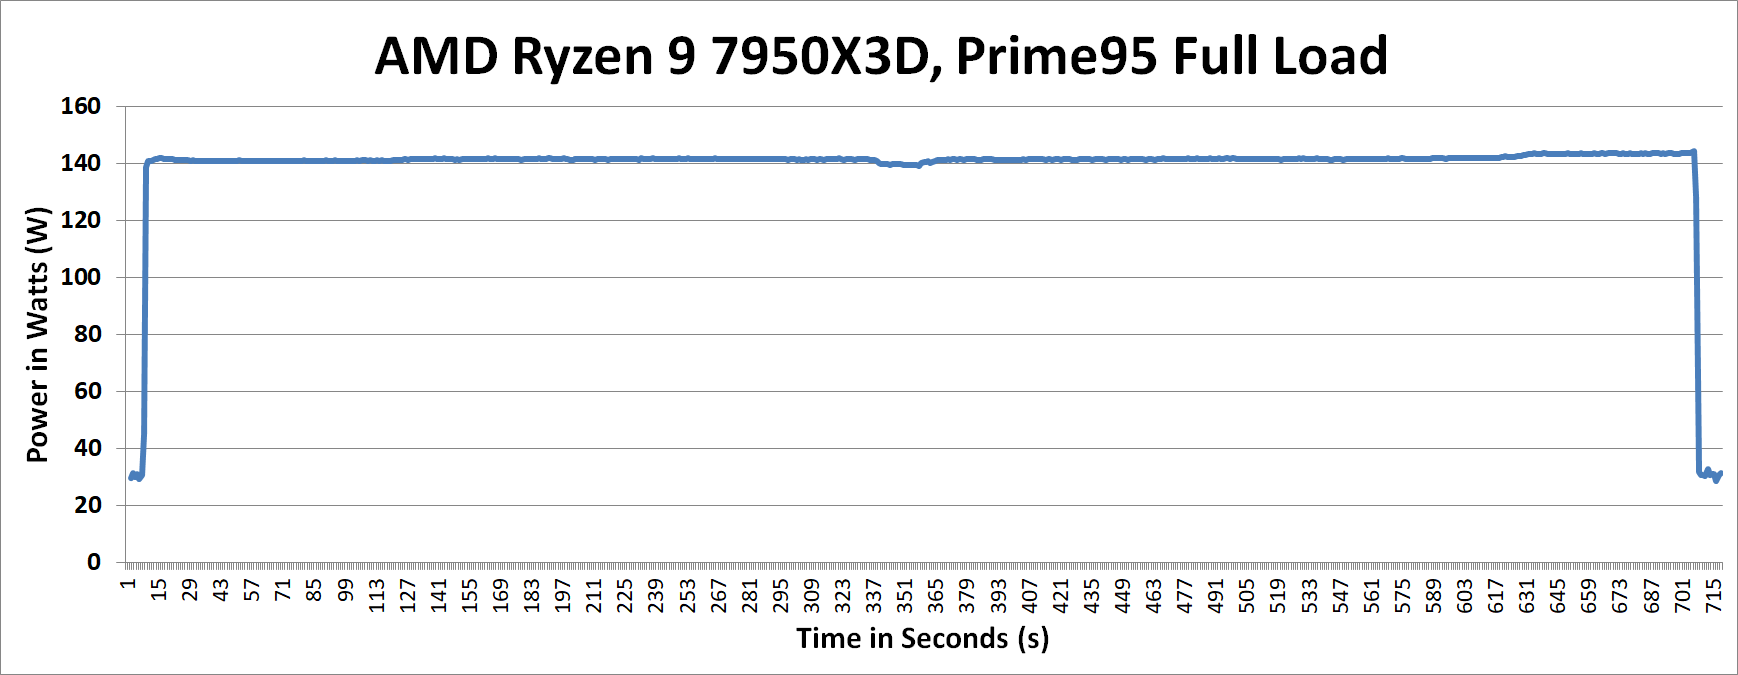
Looking at the power consumption of the Ryzen 9 7950X3D in closer detail, we can see that it delivered a consistent load of between 140 and 144 W in our Prime95 sustained power test. This is around 18 Watts lower than the official Package Power Tracking (PPT) level AMD has set at 162 W. However, it operates higher than the TDP of 120 W, which is to be expected. The TDP and PPT ratings are different as the TDP is the base power the CPU should be drawing, while the PPT (socket), set at 162 W, is the maximum the processor can draw as a maximum under full load.
Office/Web
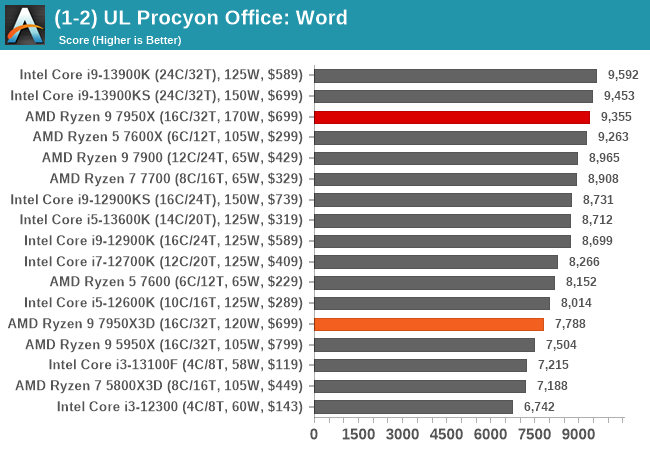
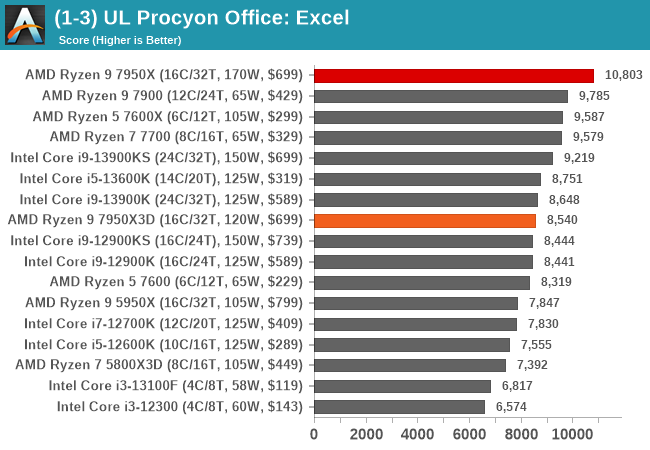
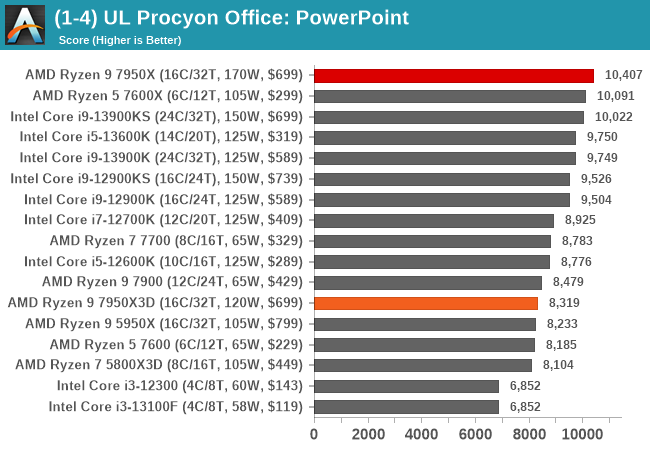
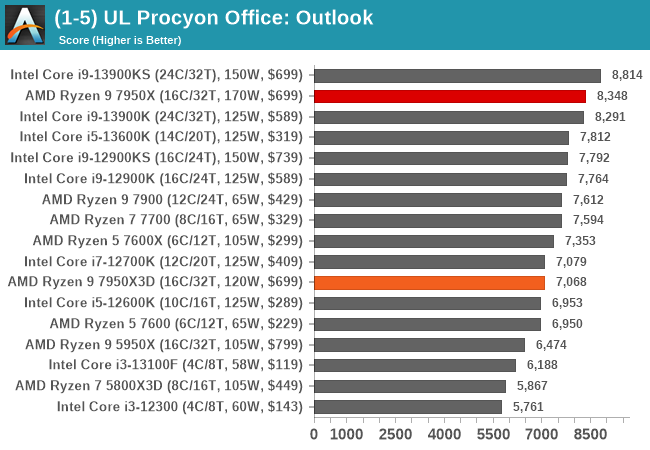
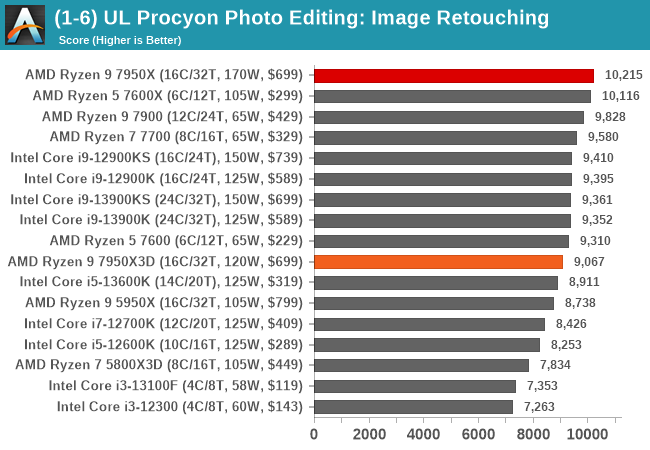
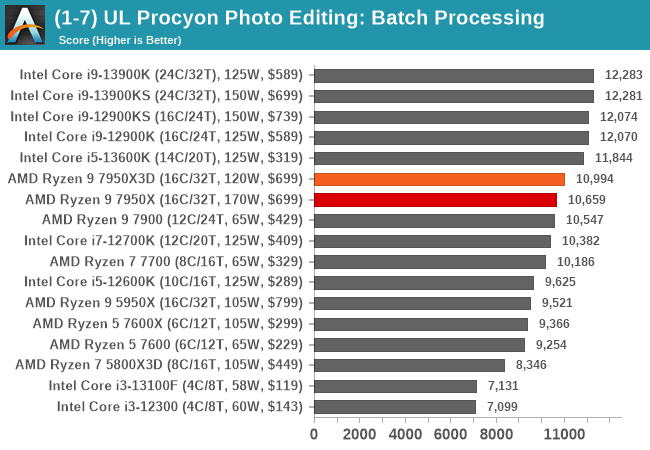
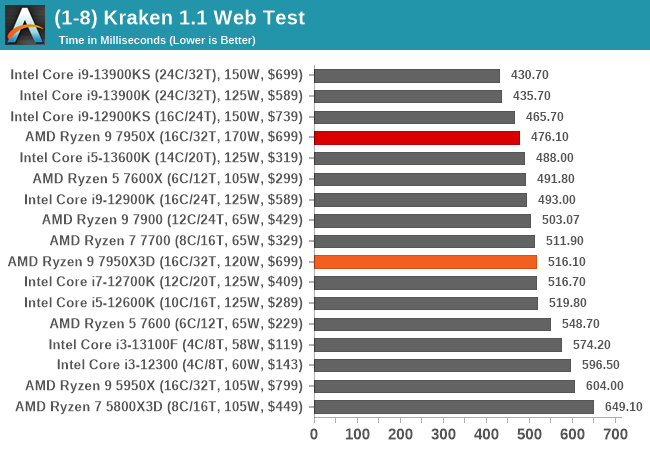
In our office-based testing, the Ryzen 9 7950X3D performs a little worse than the 7950X, but this is to be expected given the differences in TDP, PPT, and the overall power envelope. Still, the 7950X3D performs well and is more than suitable for office and web-based tasks.


122 Comments
View All Comments
Hulk - Monday, February 27, 2023 - link
10% average at 1440p. https://www.tomshardware.com/reviews/amd-ryzen-9-7...That's over the 7950X. 5% over 13900K on average. And then slower in all applications.
Nice cherry picking.
But hey, if you need to get from 178fps to 205 that bad then go for it and lose speed everywhere else where you'll actually notice it. lol
Cooe - Wednesday, March 1, 2023 - link
You are regularly GPU bound at 1440p you freaking dingus... 🤦 But the R9 7950X3D will be able to utilize more of a future high end GPU upgrade for a 1440p or 4K gaming rig than if you went with a slower gaming chip. Why? Because at 1440p and ESPECIALLY 4K IT HAS SIGNIFICANT LEFTOVER CPU HEADROOM! (This might be a hard concept for your peanut brain to grasp).If all you care about is high resolution gaming performance with current GPU's just get a i3-12100F and STFU while recognizing you'll likely need to replace it in when faster GPU's come out.
CPU's are benchmarked for gaming at 1080p for a reason Mr. Tech Illiterate. 🤦 It's to remove GPU bottlenecking as much as possible so that you're ACTUALLY TESTING THE CPU vs your graphics card!
Gastec - Wednesday, March 1, 2023 - link
A $5000 high-end GPU, mark my words!Gastec - Wednesday, March 1, 2023 - link
1080p (p from pitiful) FTW, until the end of time! What's that doomsdays clock sayin' nowadays, 2 nanoseconds to midnight, or what?haukionkannel - Monday, February 27, 2023 - link
Just like 5800x vs 5800x3d!So very impressive in gaming and less in productivity.
LonnieG - Monday, February 27, 2023 - link
Look at the power consumption reduction. This is a real cost. Waste heat from the power supply, extra HVAC loads, more fan speed / noise. These factors are real and have a monetary value as well.DanNeely - Monday, February 27, 2023 - link
The X3D has significantly more hardware running in a lower power budget. As a result, max boost not withstanding I suspect that it's generally running at lower clock speeds than the conventional part.From an engineering standpoint I'd be interested in seeing what the comparison looks like with them forced to run at identical clocks.
For more even real world results, can the X3D part have it's power level/clocks be increased to match where the non-3d part operates at? I know the 5800X3D had minimal overclockability, the rumor mill for the current generation has gone back and forth repeatedly; I'm unsure what the current/final status for it is.
Byte - Monday, February 27, 2023 - link
The limit here is def the 3D cache and its 89C temp TjmaxxTargon - Tuesday, February 28, 2023 - link
The X3D parts have a lower TDP rating, so yes, they run at a lower clock speed.Dante Verizon - Monday, February 27, 2023 - link
You should change the setting to prioritize caching on the problematic results so we have both data...