Mushkin Atlas mSATA (240GB & 480GB) Review
by Kristian Vättö on December 16, 2013 1:10 PM ESTPerformance Consistency
In our Intel SSD DC S3700 review Anand introduced a new method of characterizing performance: looking at the latency of individual operations over time. The S3700 promised a level of performance consistency that was unmatched in the industry, and as a result needed some additional testing to show that. The reason we don't have consistent IO latency with SSDs is because inevitably all controllers have to do some amount of defragmentation or garbage collection in order to continue operating at high speeds. When and how an SSD decides to run its defrag and cleanup routines directly impacts the user experience. Frequent (borderline aggressive) cleanup generally results in more stable performance, while delaying that can result in higher peak performance at the expense of much lower worst-case performance. The graphs below tell us a lot about the architecture of these SSDs and how they handle internal defragmentation.
To generate the data below we take a freshly secure erased SSD and fill it with sequential data. This ensures that all user accessible LBAs have data associated with them. Next we kick off a 4KB random write workload across all LBAs at a queue depth of 32 using incompressible data. We run the test for just over half an hour, nowhere near what we run our steady state tests for but enough to give a good look at drive behavior once all spare area fills up.
We record instantaneous IOPS every second for the duration of the test and then plot IOPS vs. time and generate the scatter plots below. Each set of graphs features the same scale. The first two sets use a log scale for easy comparison, while the last set of graphs uses a linear scale that tops out at 40K IOPS for better visualization of differences between drives.
The high level testing methodology remains unchanged from our S3700 review. Unlike in previous reviews however, we vary the percentage of the drive that gets filled/tested depending on the amount of spare area we're trying to simulate. The buttons are labeled with the advertised user capacity had the SSD vendor decided to use that specific amount of spare area. If you want to replicate this on your own all you need to do is create a partition smaller than the total capacity of the drive and leave the remaining space unused to simulate a larger amount of spare area. The partitioning step isn't absolutely necessary in every case but it's an easy way to make sure you never exceed your allocated spare area. It's a good idea to do this from the start (e.g. secure erase, partition, then install Windows), but if you are working backwards you can always create the spare area partition, format it to TRIM it, then delete the partition. Finally, this method of creating spare area works on the drives we've tested here but not all controllers are guaranteed to behave the same way.
The first set of graphs shows the performance data over the entire 2000 second test period. In these charts you'll notice an early period of very high performance followed by a sharp dropoff. What you're seeing in that case is the drive allocating new blocks from its spare area, then eventually using up all free blocks and having to perform a read-modify-write for all subsequent writes (write amplification goes up, performance goes down).
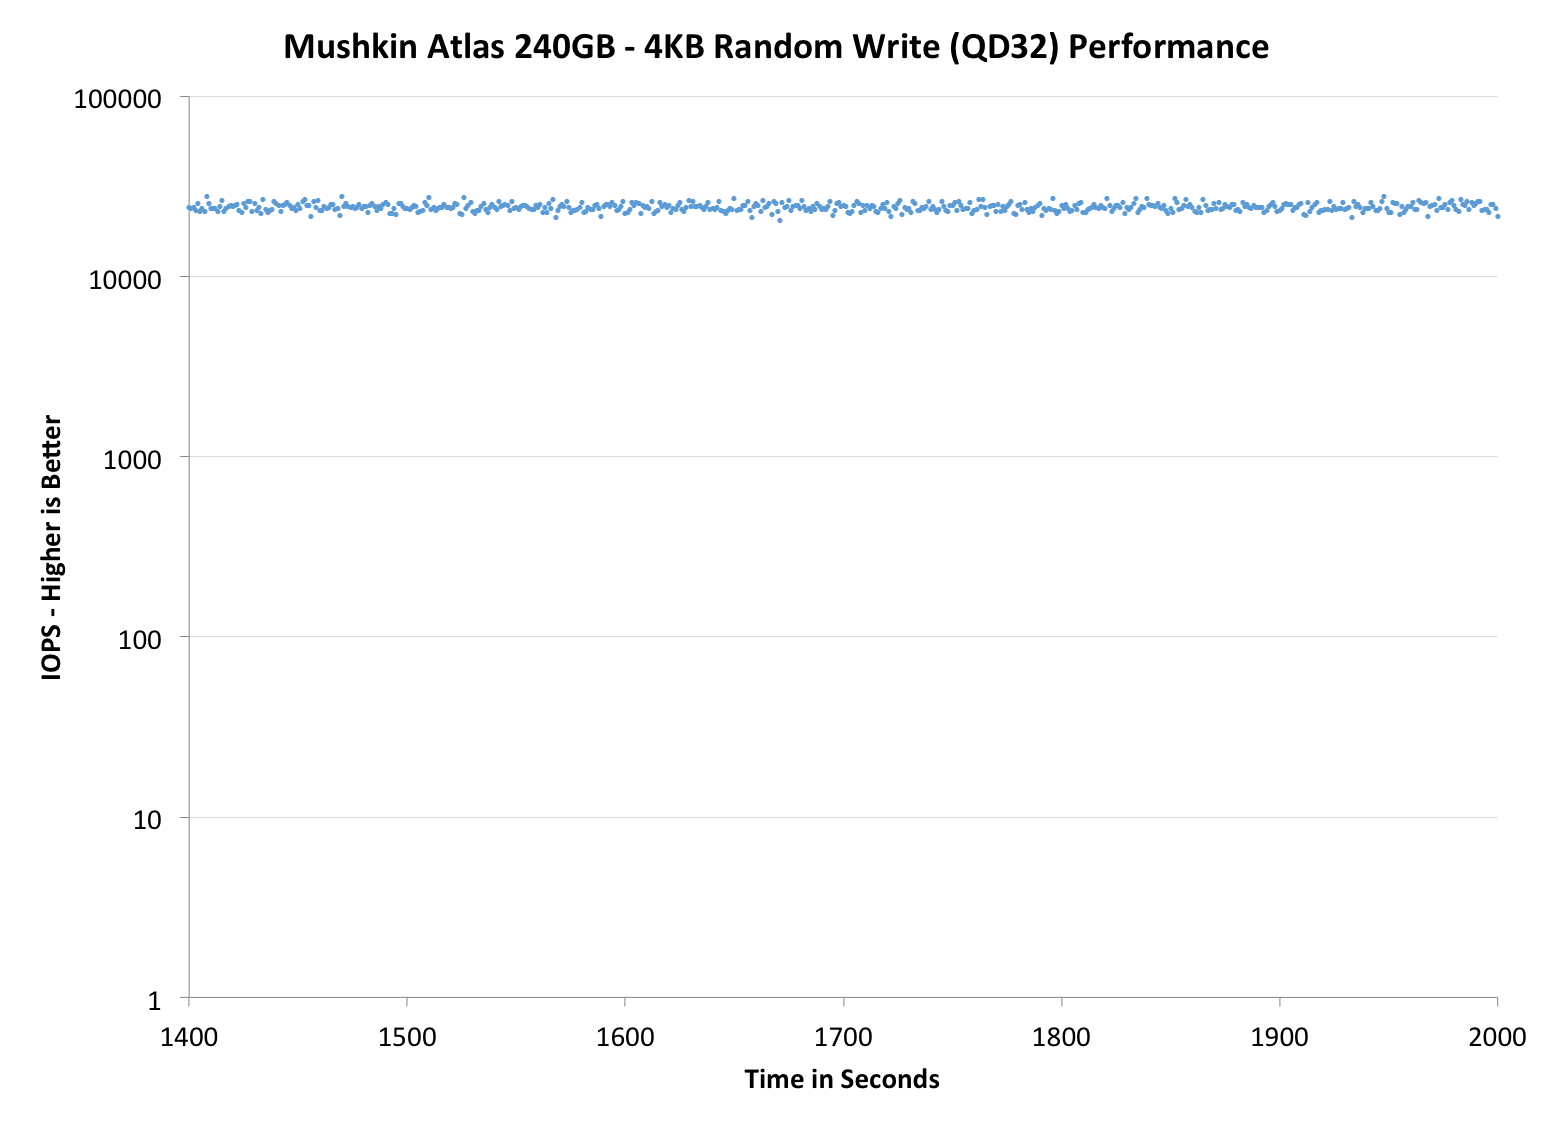
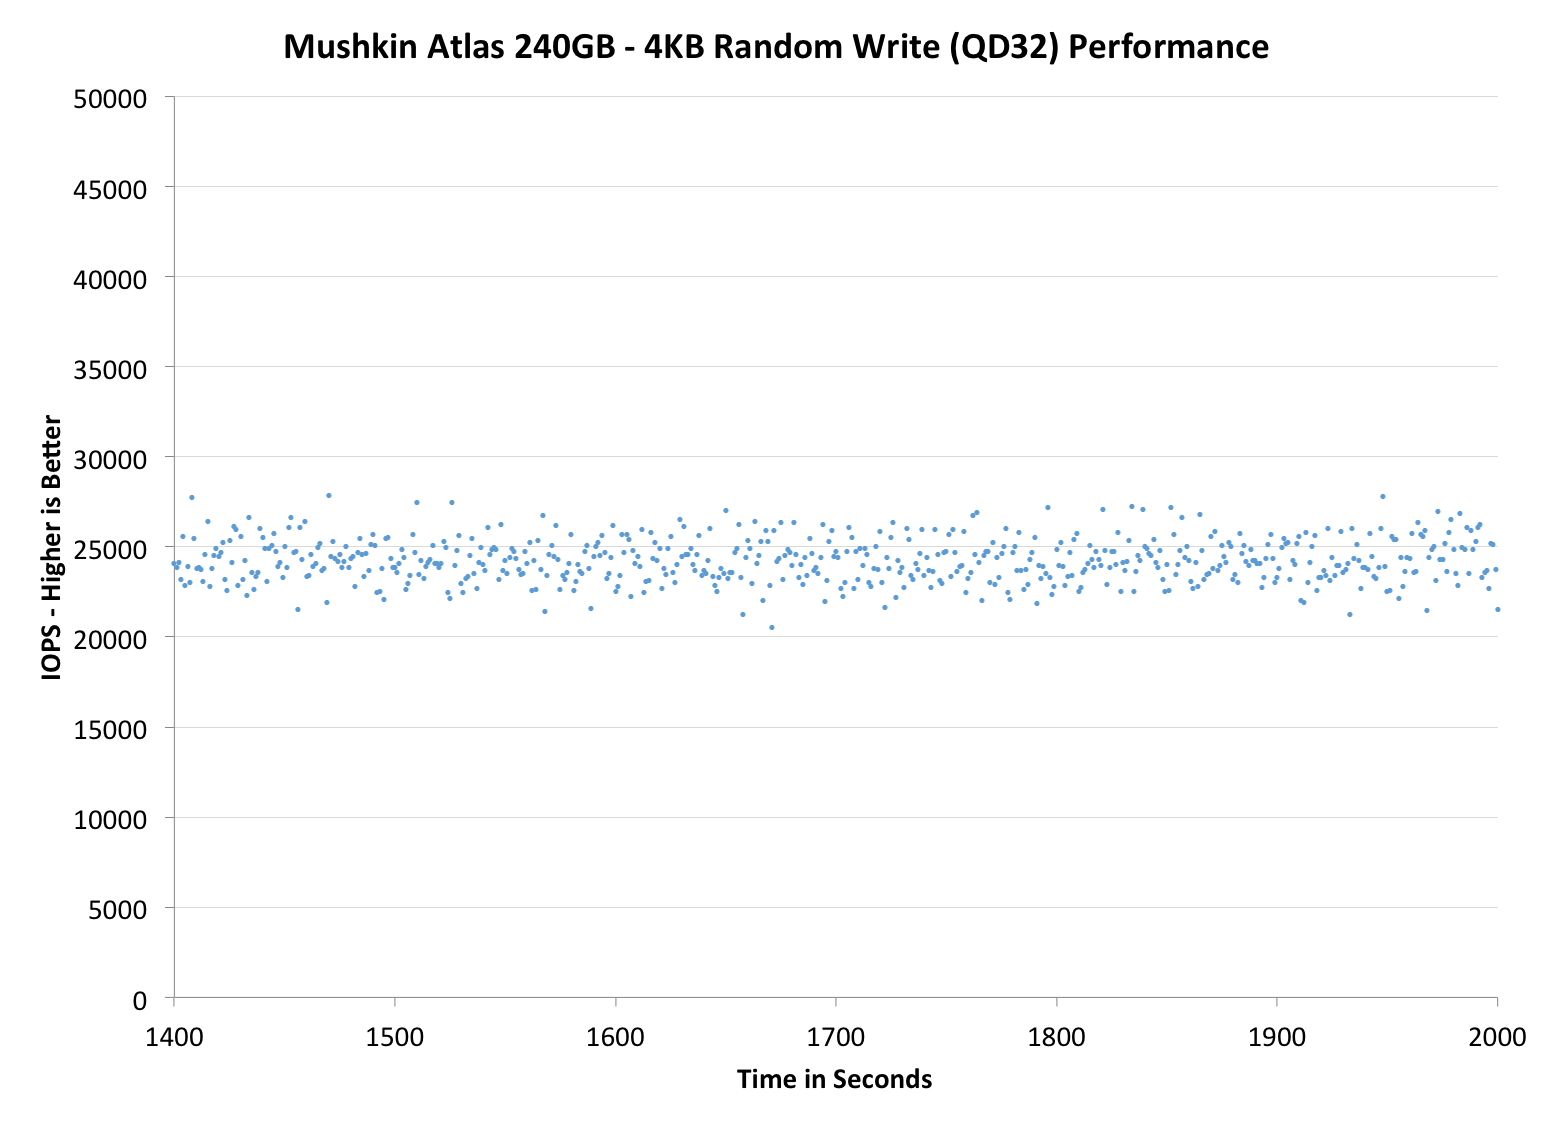
The second set of graphs zooms in to the beginning of steady state operation for the drive (t=1400s). The third set also looks at the beginning of steady state operation but on a linear performance scale. Click the buttons below each graph to switch source data.
 |
|||||||||
| Mushkin Atlas 240GB | Mushkin Atlas 480GB | Intel SSD 525 | Plextor M5M | Samsung SSD 840 EVO 250GB | |||||
| Default | |||||||||
| 25% OP | - | - | |||||||
Quite surprisingly, the 240GB model has great IO consistency but the performance is significantly lower at 480GB. We've not tested any 480GB SandForce SSDs for years, so I'm not sure if this is typical behavior or unique to the 480GB Atlas. Performance can slow down when more NAND dies are added because there are more pages/blocks to track, which requires more processing power and cache to deal with. The SF-2281 silicon is over two years old, so I think it wasn't really optimized for capacities over 256GB even though the controller is capable of supporting up to 512GB with 64Gb/die NAND. The 480GB model is still okay, though, as even at steady-state the IOPS is around 5000, while for example the Plextor M5M has occasions where the IOPS drops to zero.
 |
|||||||||
| Mushkin Atlas 240GB | Mushkin Atlas 480GB | Intel SSD 525 | Plextor M5M | Samsung SSD 840 EVO 250GB | |||||
| Default | |||||||||
| 25% OP | - | - | |||||||
 |
|||||||||
| Mushkin Atlas 240GB | Mushkin Atlas 480GB | Intel SSD 525 | Plextor M5M | Samsung SSD 840 EVO 250GB | |||||
| Default | |||||||||
| 25% OP | - | - | |||||||
TRIM Validation
To test TRIM, I first filled all user-accessible LBAs with sequential data and continued with torturing the drive with 4KB random writes (100% LBA, QD=32) for 60 minutes. After torturing the drive, I measured the sequential write performance with Iometer (128KB IO size, fully random, 100% LBA, QD=1, 60 seconds). Next I TRIM'ed the drive (quick format in Windows 7/8) and reran Iometer.
| Mushkin Atlas Resiliency - Iometer Incompressible Sequential Write | |||
| Clean | Dirty | After TRIM | |
| Mushkin Atlas 240GB | 189.2MB/s | 35.2MB/s | 106.6MB/s |
As expected, performance doesn't fully recover. I've heard SandForce actually has a fix for this but it's still in validation and will be implemented once its given a green light.


27 Comments
View All Comments
Death666Angel - Wednesday, December 18, 2013 - link
"I'd love to drop in a 120/250GB SSD and use it for the OS drive" -> Does your BIOS/UEFI even support that? I've often read that SSDs that are designed as caches in laptops are on artificially limited connectors.Death666Angel - Wednesday, December 18, 2013 - link
The only scenario for me to buy an mSATA SSD is to upgrade my Samsung XE700T1C which has a 128GB Samsung mSATA (830 variety I think). Upgrading to 240GB would be too small a step to justify the effort, so I'd just go with 480GB. And there, the M500 from Crucial retails for 250€ whereas the Atlas goes for 370€. Once Samsung enters the fray for good, I think they can undercut both. So I pass the Atlas offering. The 240GB offering is more price competitive, but it is still 15€ more expansive than the M500.As for "you don't really need any peripherals with an mSATA drive.", I'd like to get a small mSATA->USB case with the drive or at least the option for a kit that is 10€ more expansive.
chadwilson - Wednesday, December 18, 2013 - link
You lost me at Sandforce.cjs150 - Thursday, December 19, 2013 - link
Outside of mobile use, the one application that msata excels at would be for a very small HTPC. Take intels latest NUC, attach a 240 Gb msata and (if you need) an internal blu ray drive, preferably in a fanless case, and you have a great HTPC systemTamaraJKent - Tuesday, December 24, 2013 - link
hiTamaraJKent - Tuesday, December 24, 2013 - link
hiTamaraJKent - Tuesday, December 24, 2013 - link
hi