Intel SSD 730 (480GB) Review: Bringing Enterprise to the Consumers
by Kristian Vättö on February 27, 2014 12:00 PM EST- Posted in
- Storage
- SSDs
- Intel
- Intel SSD 730
AnandTech Storage Bench 2013
Our Storage Bench 2013 focuses on worst-case multitasking and IO consistency. Similar to our earlier Storage Benches, the test is still application trace based—we record all IO requests made to a test system and play them back on the drive we're testing and run statistical analysis on the drive's responses. There are 49.8 million IO operations in total with 1583.0GB of reads and 875.6GB of writes. As some of you have asked, I'm not including the full description of the test for better readability, so make sure to read our Storage Bench 2013 introduction for the full details.
| AnandTech Storage Bench 2013 - The Destroyer | ||||||||||||
| Workload | Description | Applications Used | ||||||||||
| Photo Sync/Editing | Import images, edit, export | Adobe Photoshop CS6, Adobe Lightroom 4, Dropbox | ||||||||||
| Gaming | Download/install games, play games | Steam, Deus Ex, Skyrim, Starcraft 2, BioShock Infinite | ||||||||||
| Virtualization | Run/manage VM, use general apps inside VM | VirtualBox | ||||||||||
| General Productivity | Browse the web, manage local email, copy files, encrypt/decrypt files, backup system, download content, virus/malware scan | Chrome, IE10, Outlook, Windows 8, AxCrypt, uTorrent, AdAware | ||||||||||
| Video Playback | Copy and watch movies | Windows 8 | ||||||||||
| Application Development | Compile projects, check out code, download code samples | Visual Studio 2012 | ||||||||||
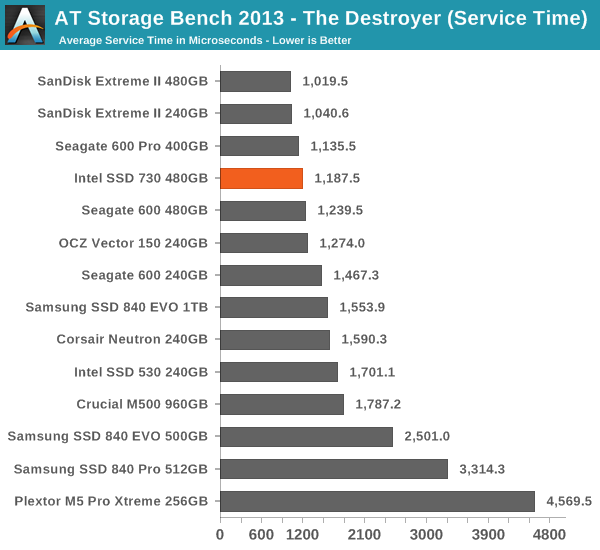
We are reporting two primary metrics with the Destroyer: average data rate in MB/s and average service time in microseconds. The former gives you an idea of the throughput of the drive during the time that it was running the test workload. This can be a very good indication of overall performance. What average data rate doesn't do a good job of is taking into account response time of very bursty (read: high queue depth) IO. By reporting average service time we heavily weigh latency for queued IOs. You'll note that this is a metric we've been reporting in our enterprise benchmarks for a while now. With the client tests maturing, the time was right for a little convergence.
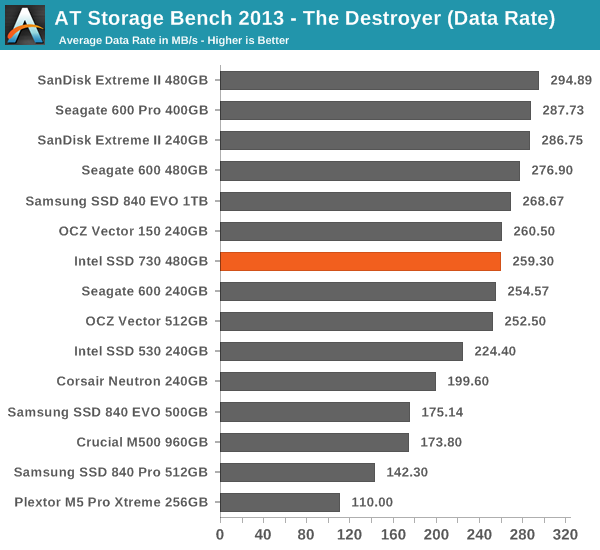
Even though the performance consistency on the SSD 730 is great, it's only mediocre in our Storage Bench 2013. The write performance of SSD 730 is class-leading but as our Storage Bench has more read than write operations, the SSD 730 loses to drives with better read performance. Whether the drive should focus on read or write performance is a question with no single correct answer because it's workload dependent. The heavy enterprise workloads the SSD 730 platform was designed for tend to be more aggressive in writes, so giving up some read performance makes sense there and carries over into the consumer version.


96 Comments
View All Comments
CrazyElf - Thursday, February 27, 2014 - link
Seeing that the SSD market is a low margin market, I get the feeling that Intel's strategy is to use it's existing reputation as a "reliable" vendor of SSD solutions and milk it so to speak. So that means little competition from a serious price to performance stand point, and more focus on product margins.NCM - Thursday, February 27, 2014 - link
I've reread the first page about 5 times and I still can't tell what controller is in this drive. There's reference to previous use of SF, but no indication of what's now in use.Did that info end up on the editing room floor?
Death666Angel - Thursday, February 27, 2014 - link
From the text "Adopting the platform from the DC S3500/S3700", "The controller is the same 8-channel design as in the S3500/S3700 but runs at 600MHz instead of the 400MHz of the S3500/S3700.". From the table "Controller Intel 3rd Generation (SATA 6Gbps)".NCM - Friday, February 28, 2014 - link
@Death666Angel (!) Thanks for the controller parsing. A rather convoluted way for readers to arrive at an answer, but we get there in the end.In a related matter the reviewer writes: "We use both standard pseudo randomly generated data for each write as well as fully random data to show you both the maximum and minimum performance offered by SandForce based drives in these tests. The average performance of SF drives will likely be somewhere in between the two values for each drive you see in the graphs."
However in none of the tables are the Sandforce drives identified. Apparently we're supposed to have memorized beforehand what controllers each drive uses. This is not some a mere quibble on my part. We have a couple of dozen workstations using SSD's, and because we work with a lot of incompressible data I do not buy drives with SF controllers.
Please AnandTech: if you're going to bother making technical distinctions of this kind, make it clear where they apply.
Mr Perfect - Friday, February 28, 2014 - link
That's strange, they used to label the drives in the charts with what controller was in them.Kristian Vättö - Saturday, March 1, 2014 - link
The controller is also listed in the table, although it's just "Intel 3rd gen" as to my knowledge it doesn't have any specific codename.As for the other feedback, the part you quoted it just a boilerplate that was we use in every review but I see that there's a need to update it.
Mipmap - Thursday, February 27, 2014 - link
"to invest in custom client-orientated silicon." oriented"There wasn't much competition and given Intel's resourced" resources
Death666Angel - Thursday, February 27, 2014 - link
Orientated/oriented is a preference thing. Neither option is wrong.CalaverasGrande - Thursday, February 27, 2014 - link
the meaning is conveyed either way, but I have always taken orientated in the same way I take "moneys'. While I understand the intent, it still sounds awkward and uneducated.redmist77 - Thursday, February 27, 2014 - link
Saying 'orientated' is as dumb as saying 'documentated' or 'adaptated.'