Intel SSD 730 (480GB) Review: Bringing Enterprise to the Consumers
by Kristian Vättö on February 27, 2014 12:00 PM EST- Posted in
- Storage
- SSDs
- Intel
- Intel SSD 730
AnandTech Storage Bench 2013
Our Storage Bench 2013 focuses on worst-case multitasking and IO consistency. Similar to our earlier Storage Benches, the test is still application trace based—we record all IO requests made to a test system and play them back on the drive we're testing and run statistical analysis on the drive's responses. There are 49.8 million IO operations in total with 1583.0GB of reads and 875.6GB of writes. As some of you have asked, I'm not including the full description of the test for better readability, so make sure to read our Storage Bench 2013 introduction for the full details.
| AnandTech Storage Bench 2013 - The Destroyer | ||||||||||||
| Workload | Description | Applications Used | ||||||||||
| Photo Sync/Editing | Import images, edit, export | Adobe Photoshop CS6, Adobe Lightroom 4, Dropbox | ||||||||||
| Gaming | Download/install games, play games | Steam, Deus Ex, Skyrim, Starcraft 2, BioShock Infinite | ||||||||||
| Virtualization | Run/manage VM, use general apps inside VM | VirtualBox | ||||||||||
| General Productivity | Browse the web, manage local email, copy files, encrypt/decrypt files, backup system, download content, virus/malware scan | Chrome, IE10, Outlook, Windows 8, AxCrypt, uTorrent, AdAware | ||||||||||
| Video Playback | Copy and watch movies | Windows 8 | ||||||||||
| Application Development | Compile projects, check out code, download code samples | Visual Studio 2012 | ||||||||||
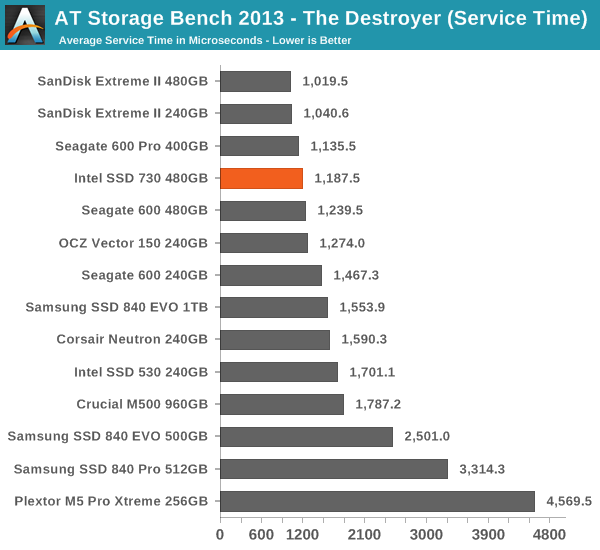
We are reporting two primary metrics with the Destroyer: average data rate in MB/s and average service time in microseconds. The former gives you an idea of the throughput of the drive during the time that it was running the test workload. This can be a very good indication of overall performance. What average data rate doesn't do a good job of is taking into account response time of very bursty (read: high queue depth) IO. By reporting average service time we heavily weigh latency for queued IOs. You'll note that this is a metric we've been reporting in our enterprise benchmarks for a while now. With the client tests maturing, the time was right for a little convergence.
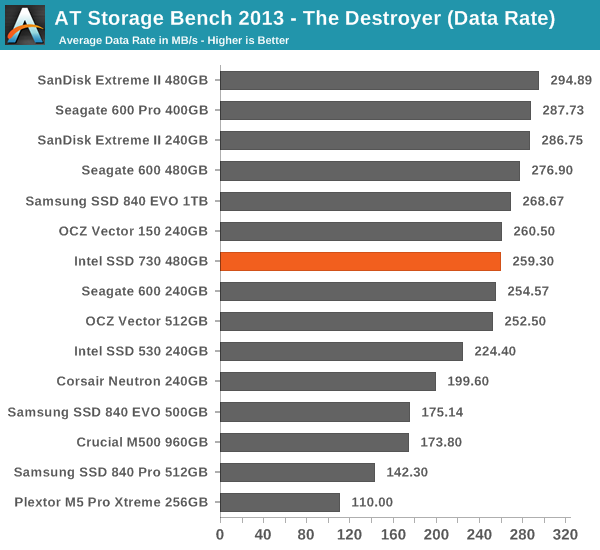
Even though the performance consistency on the SSD 730 is great, it's only mediocre in our Storage Bench 2013. The write performance of SSD 730 is class-leading but as our Storage Bench has more read than write operations, the SSD 730 loses to drives with better read performance. Whether the drive should focus on read or write performance is a question with no single correct answer because it's workload dependent. The heavy enterprise workloads the SSD 730 platform was designed for tend to be more aggressive in writes, so giving up some read performance makes sense there and carries over into the consumer version.


96 Comments
View All Comments
Namey - Friday, February 28, 2014 - link
AgreededDeath666Angel - Friday, February 28, 2014 - link
Hm, so the Oxford Dictionary recognized word "monies" sounds uneducated to you? And it seems that documentated and adaptated are perfectly fine and acceptable words as well. Just because you don't use them in every day language or they sound weird does not mean they are not correct. There are many different types of spoken and written English language. And making fun of one of the (correct) ways to write that language does seem, what's the word, uneducated. :PMipmap - Thursday, February 27, 2014 - link
"build a drive significantly that was better than the other offerings."build a drive that was significantly better than the other offerings.
JarredWalton - Thursday, February 27, 2014 - link
Man, I seriously flubbed that sentence/paragraph on the editing pass. I think I tried to copy/paste to rearrange words but somehow missed. LOLGuspaz - Thursday, February 27, 2014 - link
The endurance figures must be wrong. They're quoting that the drive supports only 267 cycles before it dies (128TB / 480GB = ~267), which is absurdly low. This is supposed to be high endurance MLC, but even Samsung's TLC has multiple times higher endurance than that...KAlmquist - Thursday, February 27, 2014 - link
Perhaps Intel is assuming 3000 cycles and a worst case write amplification of 12. (If you aren't familiar with write amplification, see Anand's early SSD articles on this site.)Guspaz - Thursday, February 27, 2014 - link
Intel previously claimed a write amplification of 1.1 way back in the G1 days. Are you saying that this drive has an order of magnitude worse write amplification than their oldest drives?futrtrubl - Friday, February 28, 2014 - link
Remember that they are using enterprise metrics and not client metrics on this. It could be the you can be more flexible on the WA you can assume on client drives.Guspaz - Friday, February 28, 2014 - link
Perhaps, but don't you think that the order of magnitude reduction in claimed write endurance deserves a call out in the article, if only to explain why that's the case?KAlmquist - Friday, February 28, 2014 - link
The 1.1 write amplification was presumably typical rather than worst case. I wouldn't expect the write amplification to be that much different from the G1. The large block and page sizes probably make write amplification a bit worse, but the algorithms may have improved a bit.I agree with your comment below that it would have been nice if the reviewer had queried Intel about the endurance spec, rather than leaving us to speculate.