Micron M500DC (480GB & 800GB) Review
by Kristian Vättö on April 22, 2014 2:35 PM ESTRandom & Sequential Performance
We are currently in the process of updating our enterprise SSD test suite and the new random and sequential performance tests are the first fruits of that. In the past our tests were set to a certain queue depth (mostly 32 in the enterprise tests), which didn't give the full picture of performance. As enterprise workloads are almost always unique, the queue depths vary greatly and the proper way to test performance is across all the possible queue depths. In our new tests we are now testing queue depth scaling from one to all the way to 128. While it's unlikely for enterprise workloads to have small queue depths, testing them gives us an important look into the architecture of the drive. Similarly, it's rare for even the more demanding enterprise workloads to exceed queue depth of 64 but we are still including the 128 in case it matters to some of you.
Since we are testing an enterprise class drive, we cannot look at the performance in a secure erased state as that would be unrealistic. Enterprise workloads tend to stress the drive 24/7 and thus we need to simulate the worst case performance by preconditioning the drive into steady-state before running the actual tests. To do this, we first fill the drive with sequential 128KB data and proceed with 4KB random writes at a queue depth of 32. The length of the torture depends on the drive and its characteristics but in the case of the M500DC, I ran the 4KB random write workload for two hours. As the performance consistency graphs on the previous page show, two hours is enough for the M500DC to enter steady-state and ensure consistent results.
After the preconditioning, we tested the performance across all queue depths at full LBA with Iometer. The test was ran for three minutes at each queue depth and the next test was started right after the previous one to make sure the drive was given no time to rest. The preconditioning process was repeated before every test (excluding read tests, which were run right after write tests) to guarantee that the drive was always in steady-state when tested.
4KB Random Performance
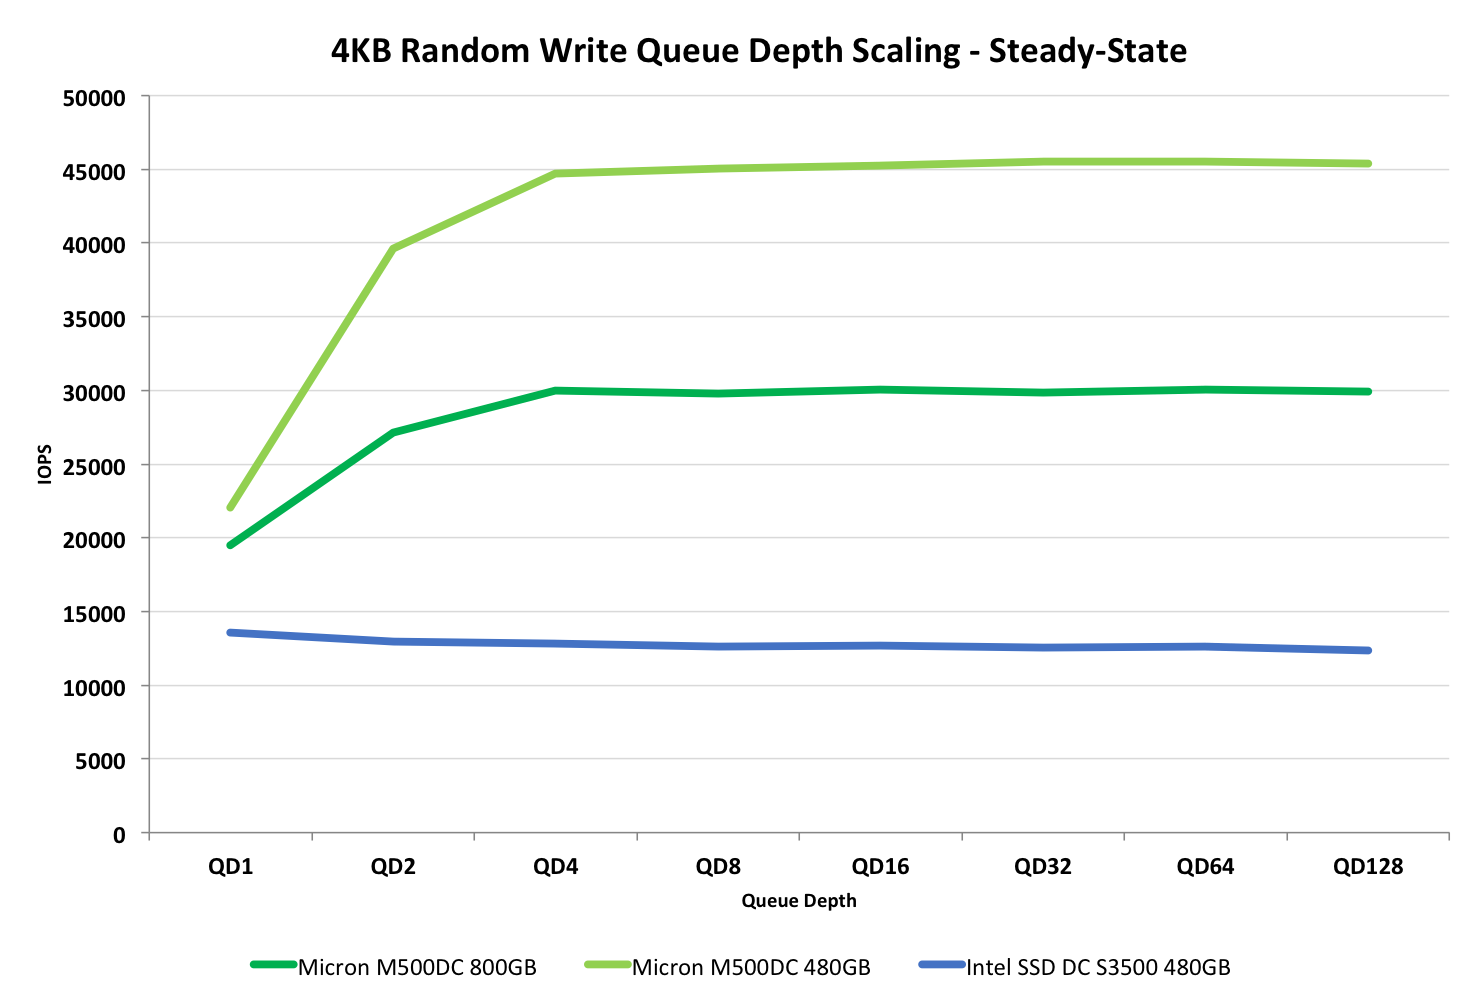
The random write scaling graph shows pretty much the same as our consistency tests. After the queue depth of four the performance reaches its limit and no longer scales. Interestingly, the DC S3500 doesn't scale at all, although it's performance is low to begin with when compared with the M500DC. (This is due to the difference in over-provisioning -- the S3500 only has 12% whereas the M500DC has 27/42%.)
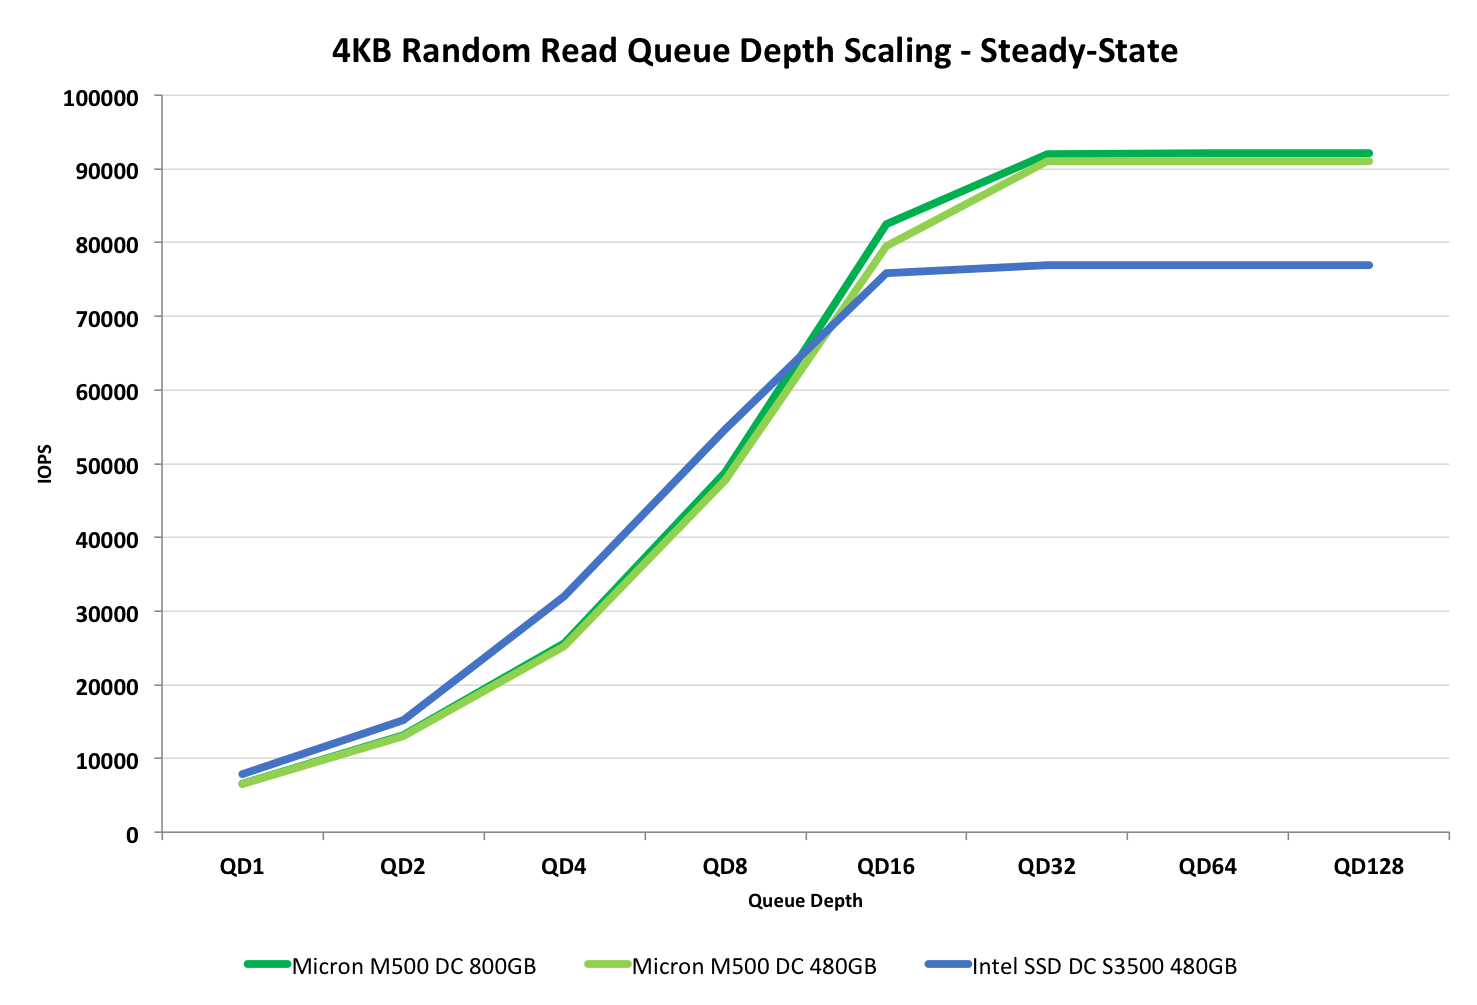
Random read performance, on the other hand, behaves a bit differently. As steady-state doesn't really affect read performance, the performance scales all the way to 90K IOPS. The M500DC does well here and is able to beat the S3700 quite noticeably for typical enterprise workloads. The S3500 does have a small advantage at smaller queue depths but at QD16 and after, which are what matter for enterprise customers, the M500DC takes the lead.
4KB Random 70% Read - 30% Write Performance
Typically no workload is 100% read or write, so to give a perspective of a mixed workload we are now including a 4KB random test with 70% read and 30% write commands. The LBA space is still 100% and the IOs are fully random, something which is also common for enterprise workloads.
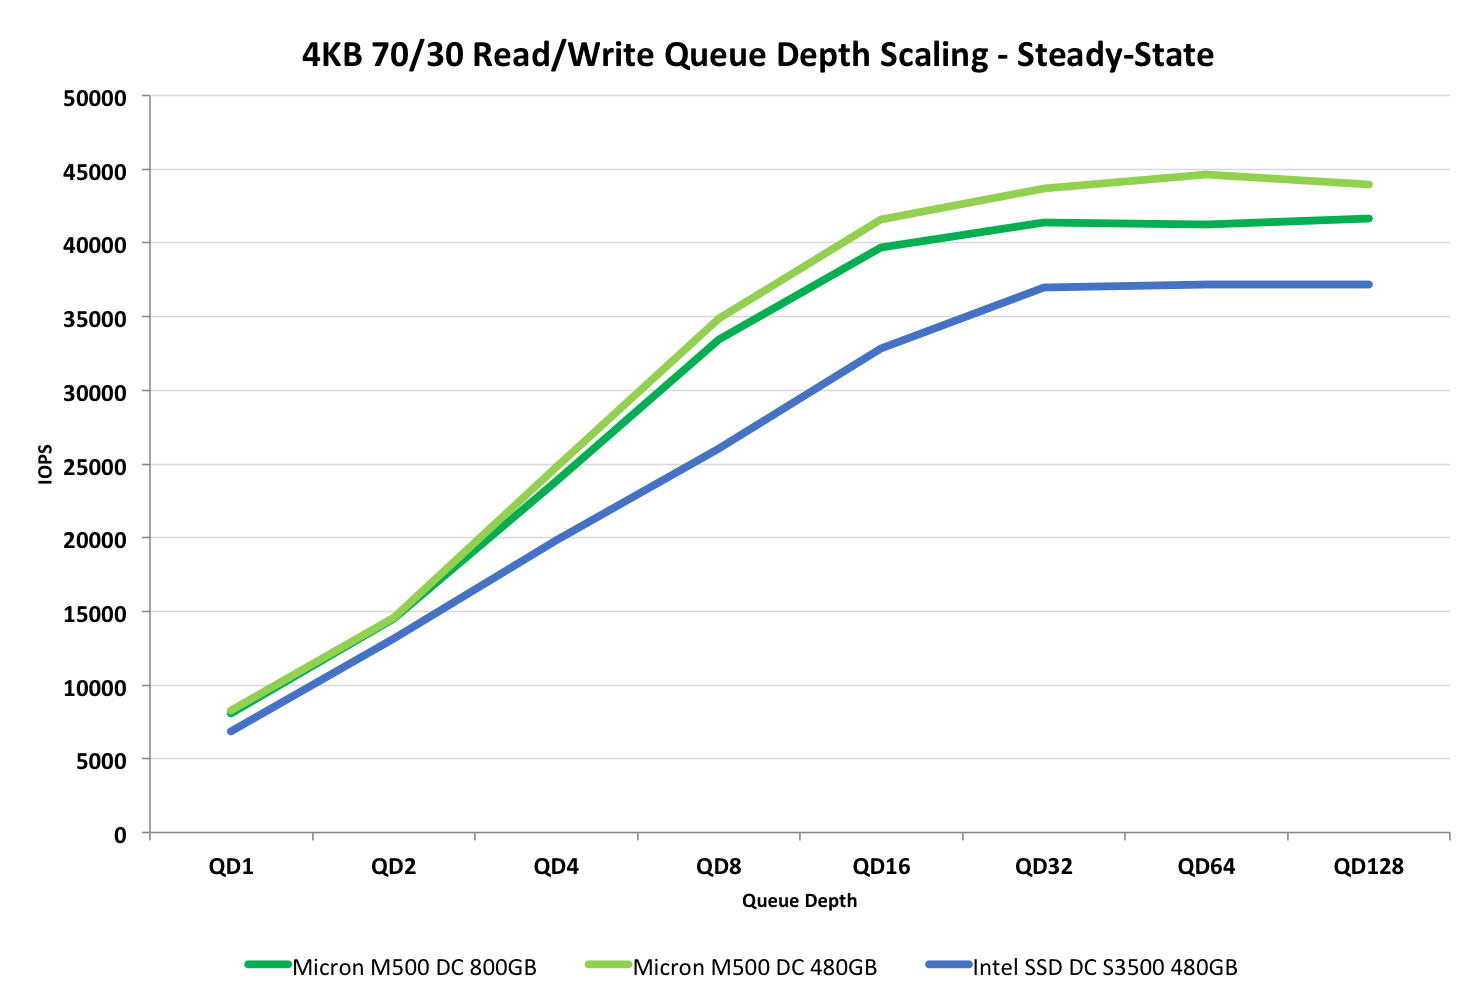
Once again the M500DC beats the DC S3500, which is mostly due to its superior random write performance. This is also the only workload where scaling happens up to queue depth of 32.
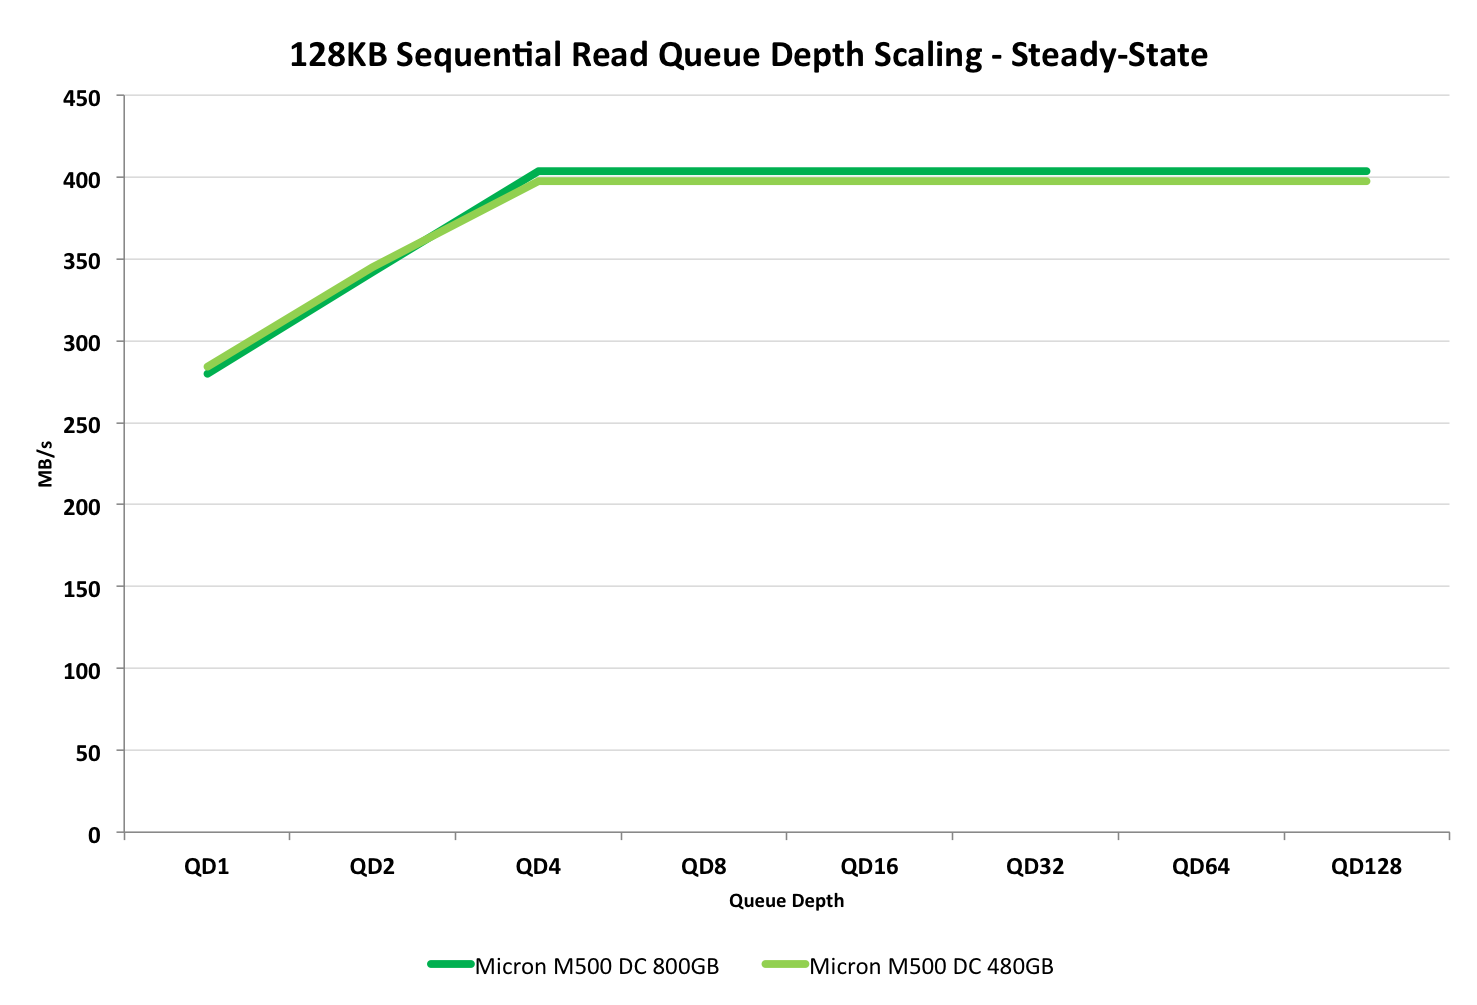
128KB Sequential Performance
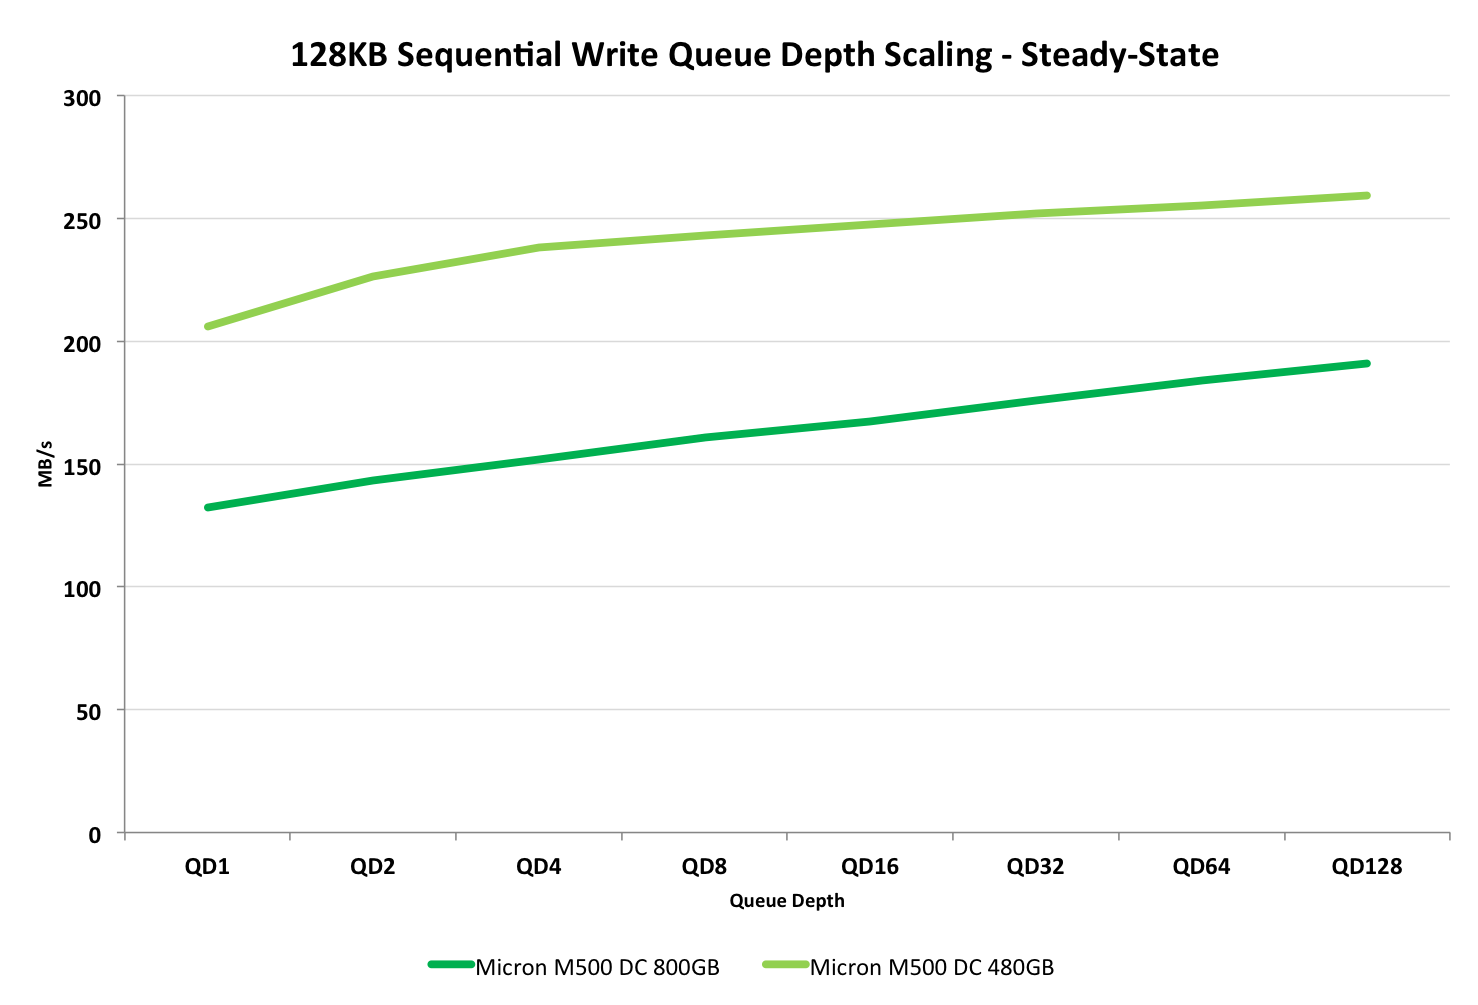
Due to lack of time, I unfortunately don't have results for the sequential performance of the DC S3500. However, the tests still provide a look into the M500DC even though the graphs lack a comparison point.
The 480GB M500DC is again significantly faster than the 800GB model thanks to the added over-provisioning. Bear in mind that these are steady-state figures, which is why the performance may seem a bit slow compared to what we usually see in benchmarks.
In terms of sequential read performance, on the other hand, the drives appear equal.


37 Comments
View All Comments
Samus - Wednesday, April 23, 2014 - link
I think the price is ridiculous, nearly twice as expensive as the reliable Intel S3500 and almost as expensive as the uber-superior S3700. Makes no sense.ZeDestructor - Wednesday, April 23, 2014 - link
Lot's of lack of time in some sections...Granted, new benchmarks, but IMO that should be split off to a seperate article and the entire thing delayed for publishing to get the tests done. Otherwise, excellent revewing as always.
okashira - Wednesday, April 23, 2014 - link
If you want a drive with good speed , low price and amazing endurance, just pick up a used Samsung 830 for cheap.People have tested them to 25,000 cycles. That's 10+ PB for a 512GB drive, for just $300 or less. And I suspect their data retention is superior as well.
Solid State Brain - Wednesday, April 23, 2014 - link
Thing is, while older consumer drives with quality MLC NAND might appear to have an exceptional P/E rating until failure (which occurs when wear is so high that the data retention gets so short the uncorrectable bit error rate so extreme that the controller can't keep the drive in a working state anymore, not even when powered), there's no way their manufacturer will guarantee such usage.On a related note, all consumer Samsung 840 drives (with TLC memory) I've seen pushed through in stress endurance testings posted on the internet have reached at least ~3200-3500 P/E cycles until failure and didn't start show any SMART error before 2800-2900 cycles, which means that the approximate ~1800-2000 P/E rating (for the stated TBW endurance with sequential workloads) for TLC-NAND datacenter enterprise Samsung SSDs drives (@ a 3 months data retention) makes much sense. But again, no way Samsung will offer any guarantee for such usage with consumer or workstation drives. they will just tell you they are tested for consumer/light workloads.
Real endurance figures for NAND memory in the SSD market has to be one of the industry's best kept secrets.
AnnonymousCoward - Friday, April 25, 2014 - link
Ever think of doing a real world test, measuring "time"? Everyone should know synthetic benchmarks for hard drives are meaningless. Why don't you do a roundup of drives and compare program load time, file copy time, boot time, and encoding time. Am I a freakin genius to think of this?MrPoletski - Saturday, April 26, 2014 - link
Why does every single performance consistency graph say 4KB random write QD 32?markoshark - Sunday, April 27, 2014 - link
I'm wondering if any testing is done with a 30/70 read/write ratio - Most i've seen is 70% read.With enterprise drives, they are often rebadged and used in SANs - Would be interesting to see how they compare in write-intensive enviroments (VDI)