Build-A-Rig Round 1, Zotac vs. Corsair: The $1500 PC Showdown
by Ryan Smith on August 5, 2015 6:00 AM EST- Posted in
- Build-A-Rig
- Systems
- Corsair
- ZOTAC
System Performance
Diving into our showdown, we’ll start with general system performance. While the overall challenge was for a $1500 gaming PC, good gaming performance good overall system performance frequently go hand-in-hand. With gaming stressing virtually every aspect of a system – and not just the GPU – a balanced gaming system should do well on overall system performance as well.
Starting with PCMark 8, PCMark provides various usage scenarios (home, creative and work) and offers ways to benchmark both baseline (CPU-only) as well as OpenCL accelerated (CPU + GPU) performance. We benchmarked select PCs for the OpenCL accelerated performance in all three usage scenarios. These scores are heavily influenced by the CPU in the system.
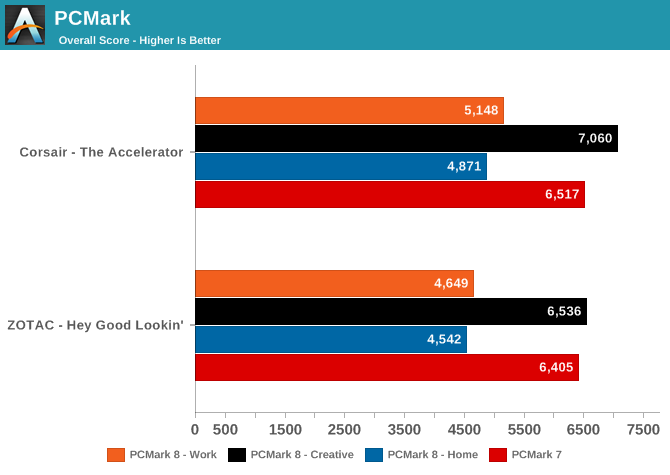
The different PCMark subtests stress test systems in slightly different ways, but overall there’s a clear pattern here, with the Corsair system always holding an advantage here, upwards of 10%. PCMark 8 in particular does stress the GPU a bit thanks to OpenCL acceleration, but it’s not significant, particularly when you’re comparing systems with high-end GPUs. So the bulk of the difference is due to the difference in processors – a Core i5-4460 (3.2GHz) in the Zotac system, and a Core i5-4690K (3.5GHz) in the Corsair system. Even then, for the older PCMark 7 the two systems are neck-and-neck.
Moving on, we have CINEBENCH R15, an image rendering benchmark. CINEBENCH provides three benchmark modes - OpenGL, single threaded and multi-threaded. Evaluation of select PCs in all three modes provided us the following results.
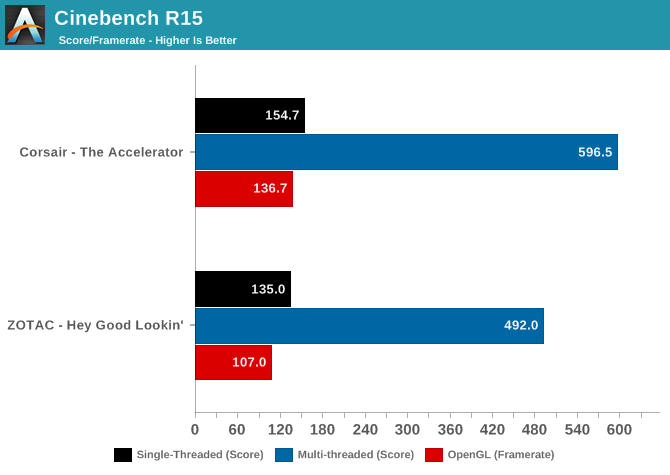
In the CPU tests the Corsair system has a 15-20% lead, in-line with the differences we’d expect from the choice in processors. Otherwise the OpenGL test is even greater, thanks to the wider difference in GPU performance.
For a look at video encoding performance we have results courtesy of x264 HD Benchmark v5.0. This is simply a test of CPU performance with good scaling with both core count and individual core performance.
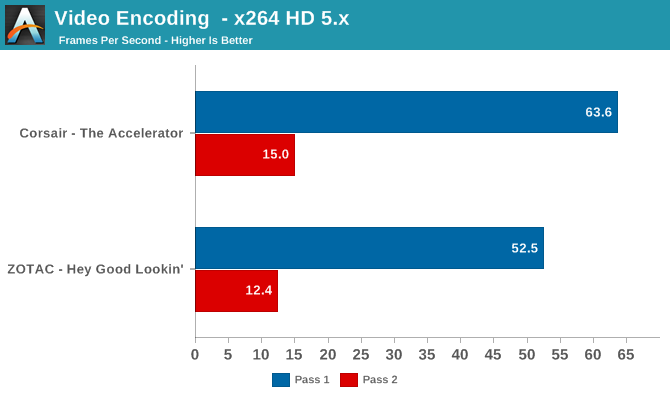
Much like under CINEBENCH, Corsair’s system is around 20% faster here, and this goes for both passes. Since the CPUs are Haswell i5s, what we’re seeing here is mostly clockspeed differences.
Up next, 7-Zip is a very effective and efficient compression program, often beating out OpenCL accelerated commercial programs in benchmarks even while using just the CPU power. 7-Zip has a benchmarking program that provides tons of details regarding the underlying CPU's efficiency. In this subsection, we are interested in the compression and decompression MIPS ratings when utilizing all the available threads.
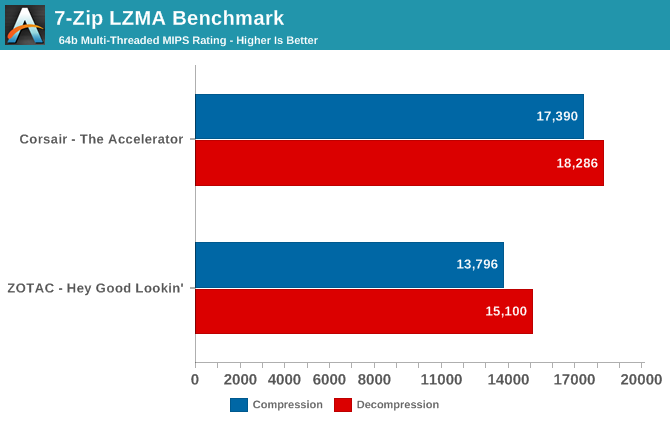
Under 7-Zip the Corsair system yet again holds a roughly 20% performance advantage. Traditionally this benchmark has also shown some sensitivity to memory speeds and timings, but since both systems use Corsair DDR3-1866 kits, this ends up being a pure clockspeed test.
Meanwhile, as businesses (and even home consumers) become more security conscious, the importance of encryption can't be overstated. TrueCrypt is a popular open-source disk encryption program can take advantage of the AES-NI capabilities of modern processors, and even though TrueCrypt is no longer under development, its internal benchmark provides some interesting cryptography-related numbers to ponder.
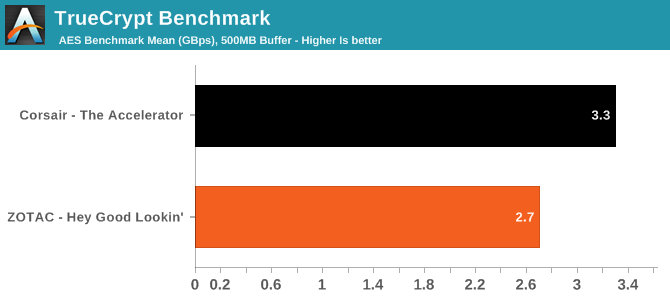
Like 7-Zip, there’s a fair bit of memory interactions here, but with our systems using identical speed memory, this is another pure clockspeed test. This leads to the Corsair system holding a 22% lead here.
Agisoft PhotoScan is a commercial program that converts 2D images into 3D point maps, meshes and textures. The program designers sent us a command line version in order to evaluate the efficiency of various systems that go under our review scanner. The command line version has two benchmark modes, one using the CPU and the other using both the CPU and GPU (via OpenCL). The benchmark takes around 50 photographs and does four stages of computation:
- Stage 1: Align Photographs
- Stage 2: Build Point Cloud (capable of OpenCL acceleration)
- Stage 3: Build Mesh
- Stage 4: Build Textures
We record the time taken for each stage. Since various elements of the software are single threaded, others multithreaded, and some use GPUs, it is interesting to record the effects of CPU generations, speeds, number of cores, DRAM parameters and the GPU using this software.
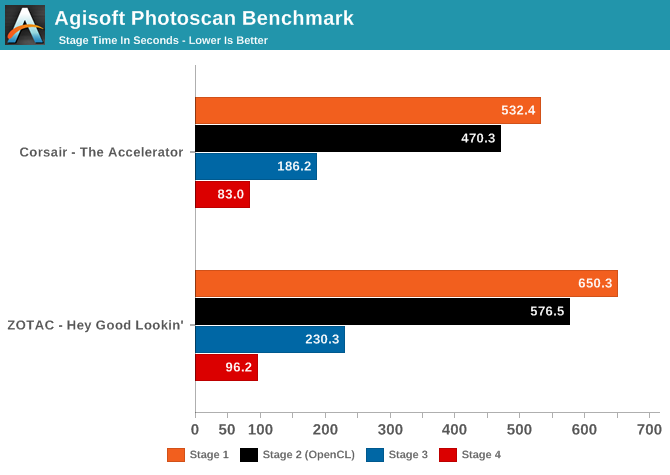
Even with GPU participation, there aren’t any surprises here. The Corsair system retains its typical lead, and both GPUs are powerful enough to shift the bottleneck back on the CPU even with the use of OpenCL.
Finally, wrapping up our system benchmark numbers is the Dolphin Emulator benchmark mode results. This is again a test of the CPU capabilities, and how well a CPU can handle emulating the Nintendo Wii’s PowerPC 750 CPU.
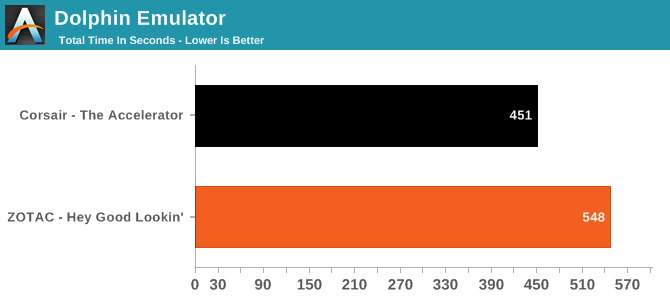
This final test is once again to the Corsair system’s advantage, this time by 18%.


21 Comments
View All Comments
Refuge - Monday, August 10, 2015 - link
It is down to perspective in the end.I like LED strips if done properly. I also thought the Zotac build was very pretty.
Mikemk - Wednesday, August 5, 2015 - link
So will the winners be announced publicly?Ryan Smith - Wednesday, August 5, 2015 - link
That's a good question. Our corporate parent technically executes the contest, so I'll check with them on the matter.Drumsticks - Wednesday, August 5, 2015 - link
These are cool! I hope you do them well into the future, it's exciting to see what the companies come up with and some friendly competition is always fun to watch.I'd love to see Dustin/future people who add unlocked CPUs to their builds have them tested with an overclock added by y'all - after all, it's a huge benefit and the CPU performance advantage for Corsair here is kind of understated without it.
Either way, no surprises with the results. Both builds did what people really expected; nobody saw Zotac winning many performance runs, but then again, they weren't really trying to with their picks.
Gasaraki88 - Thursday, August 6, 2015 - link
I don't get what the point of this article is. You take a computer that has a slower processor and video card and compare it to one that has a faster processor and video card. OK, guess who's slower?Ian Cutress - Thursday, August 6, 2015 - link
It's part of our give-a-way contest project called Build-A-Rig. We give two companies a budget and ask them to spec down a rig. We then interview them about the industry and what they chose, and then we get the parts from our partner Newegg, build the systems, test them, and then give them away to our readers.Read the intro: http://www.anandtech.com/show/9403/
Read the interviews and specification breakdowns: http://www.anandtech.com/show/9417/
Read the build logs for each system: http://www.anandtech.com/show/9474/
And this performance analysis is the final piece of the puzzle.
doggface - Sunday, August 9, 2015 - link
When I first saw that h100i in the zotac build it didnt make sense. Using it to blow away the heat from the 970 is clever.zerockslol - Saturday, August 15, 2015 - link
Anyone else notice the inconsistency with prices in the 90 day average?I added up the 90 day averages and it reached $1512.72 you're welcome
zerockslol - Saturday, August 15, 2015 - link
that was for Zotacs btwLegionosh - Monday, August 17, 2015 - link
While the Zoltac may look a little better, I'd much prefer the Corsair build due purely to performance reasons. The power consumption difference is nowhere near enough to warrant the performance difference in my opinion (and everyone has their own opinion).Granted the SSD does offer some performance benefits, but the difference in GPU and CPU performance more than makes up the difference for me. :-)