Fable Legends Early Preview: DirectX 12 Benchmark Analysis
by Ryan Smith, Ian Cutress & Daniel Williams on September 24, 2015 9:00 AM ESTComparing Percentile Numbers Between the GTX 980 Ti and Fury X
As the two top end cards from both graphics silicon manufacturers were released this year, there was all a big buzz about which is best for what. Ryan’s extensive review of the Fury X put the two cards head to head on a variety of contests. For DirectX 12, the situation is a little less clear cut for a number of reasons – games are yet to mature, drivers are also still in the development stage, and both sides competing here are having to rethink their strategies when it comes to game engine integration and the benefits that might provide. Up until this point DX12 contests have either been synthetic or having some controversial issues. So for Fable Legends, we did some extra percentile based analysis for NVIDIA vs. AMD at the top end.
For this set of benchmarks we ran our 1080p Ultra test with any adaptive frame rate technology enabled and recorded the result:
For these tests, usual rules apply – GTX 980 and Fury X, in our Core i7/i5/i3 configurations at all three resolution/setting combinations (3840x2160 Ultra, 1920x1080 Ultra and 1280x720 Low). Data is given in the form of frame rate profile graphs, similar to those on the last page.
As always, Fable Legends is still in early access preview mode and these results may not be indicative of the final version, but at this point they still provide an interesting comparison.
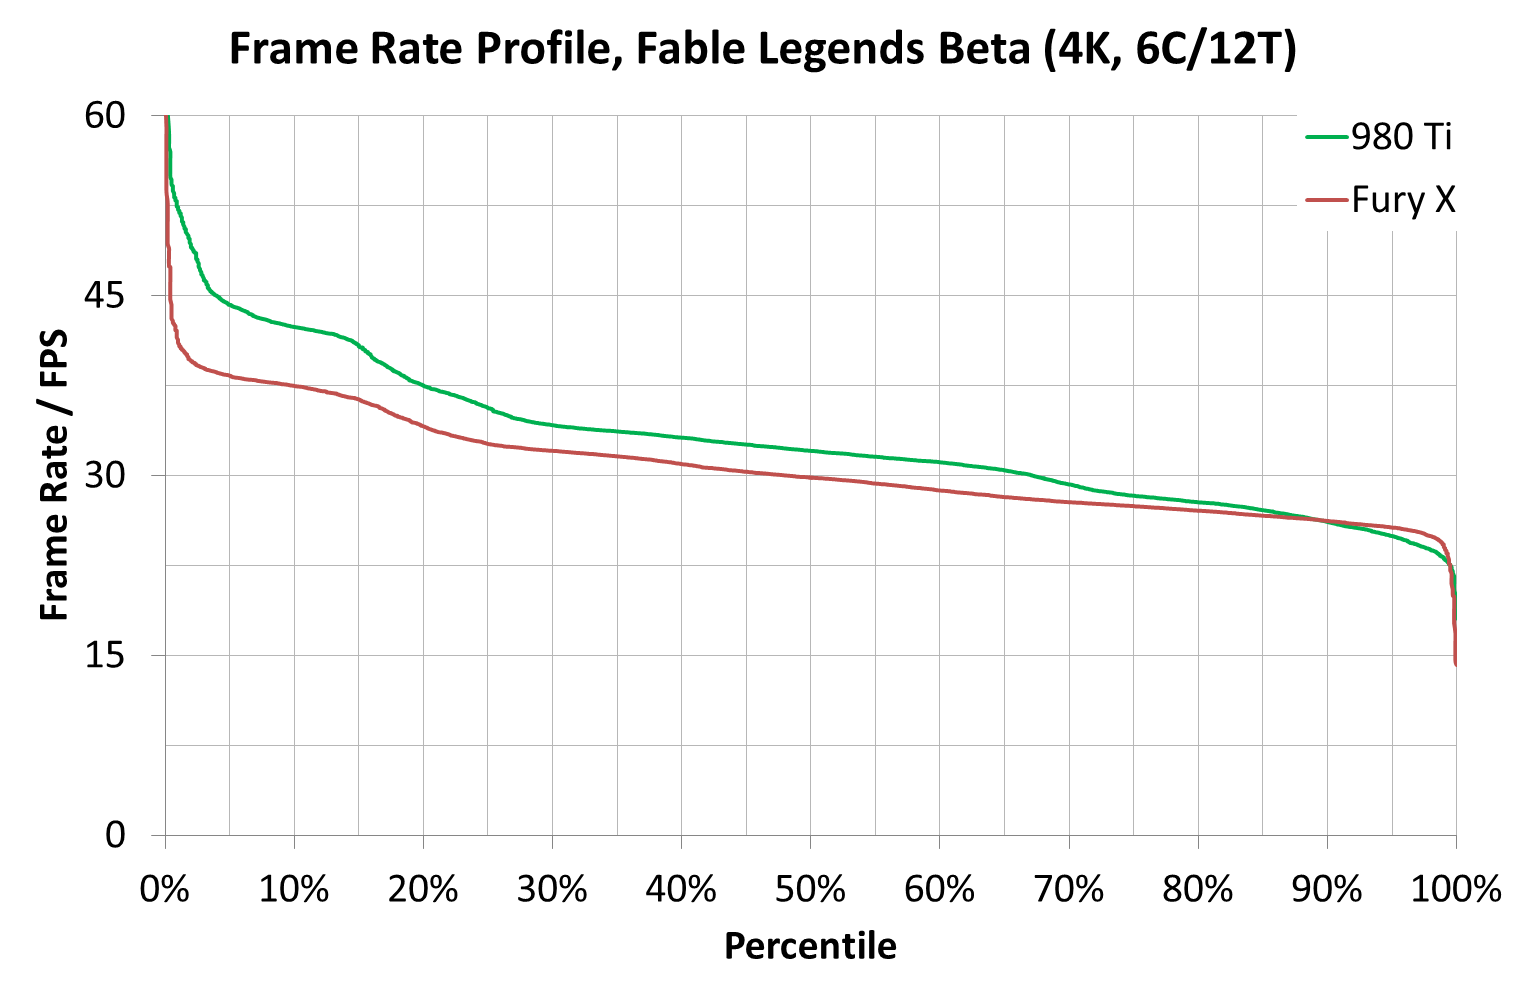
At 3840x2160, both frame rate profiles from each card looks the same no matter the processor used (one could argue that the Fury X is mildly ahead on the i3 at low frame rates), but the 980 Ti has a consistent gap across most of the profile range.
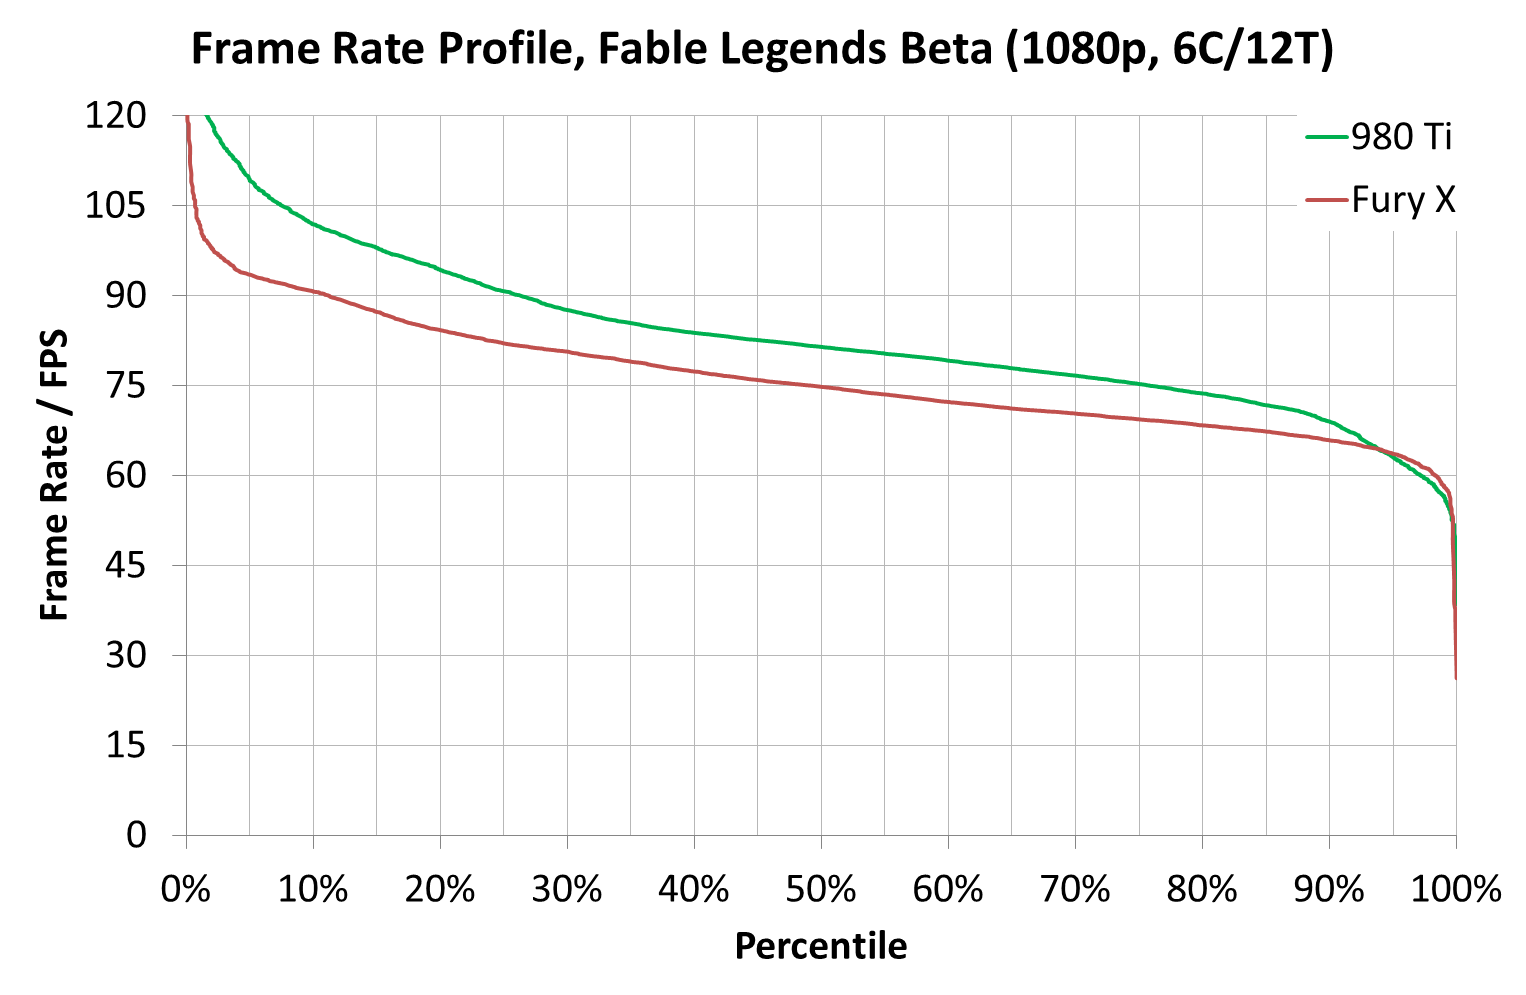
At 1920x1080, the Core i7 model gives a healthy boost to the GTX 980 Ti in high frame rate scenarios, though this seems to be accompanied by an extended drop off region in high frame rate areas. It is also interesting that in the Core i3 mode, the Fury X results jump up and match the GTX 980 Ti almost across the entire range. This again points to some of the data we saw on the previous page – at 1080p somehow having fewer cores gave the results a boost due to lighting scenarios.
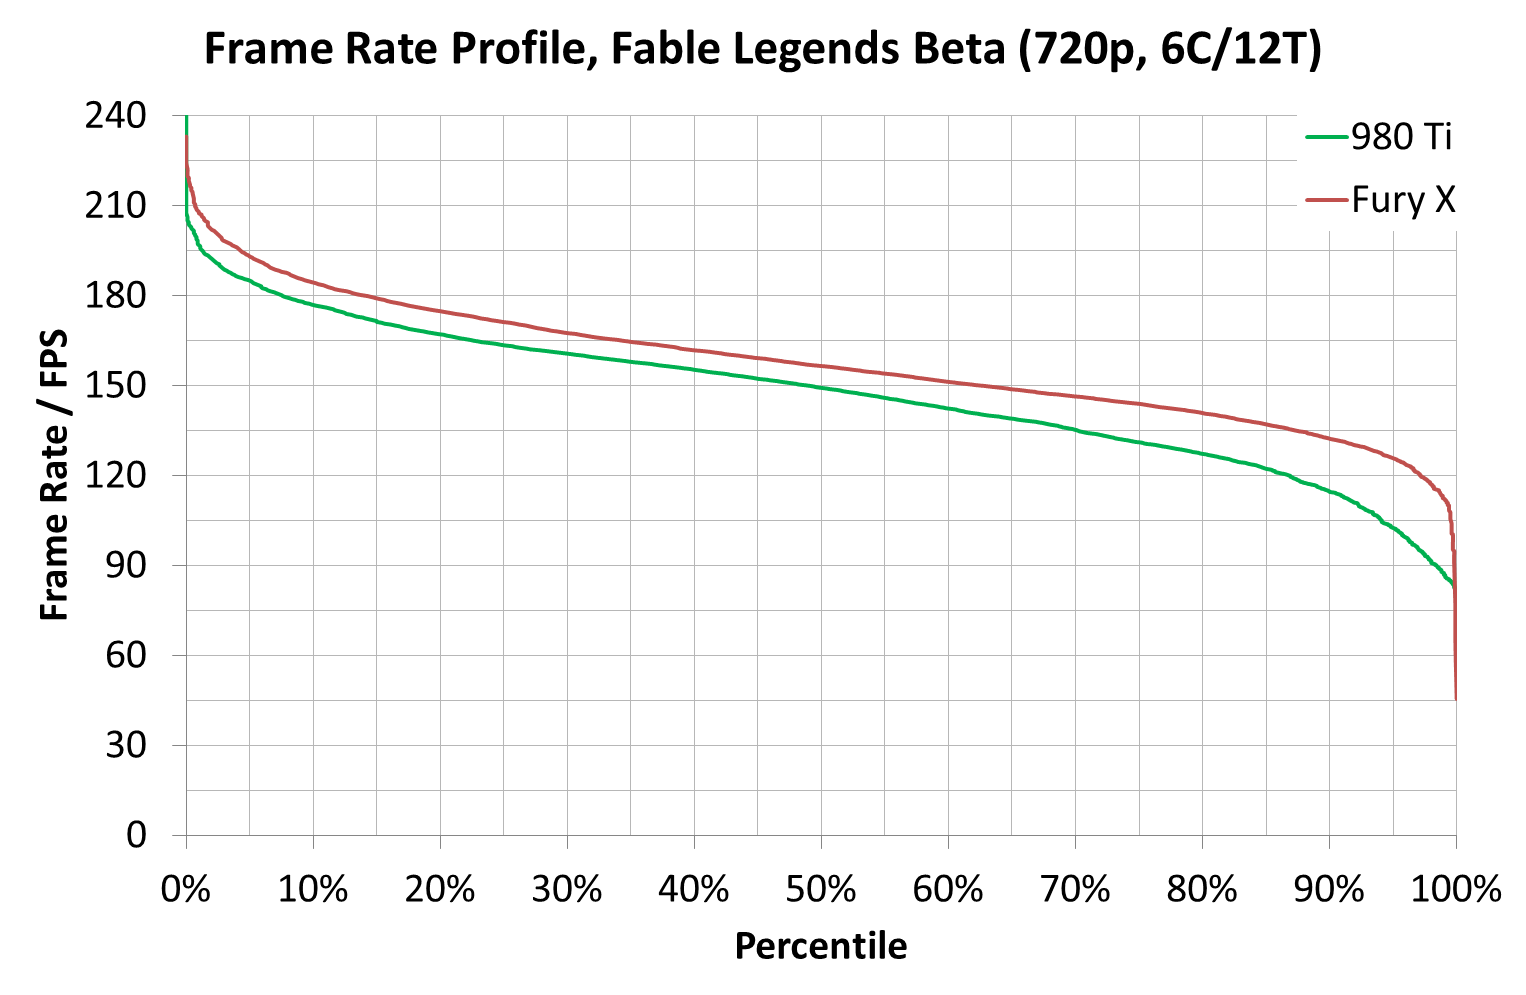
At 1280x720, as we saw in the initial GPU comparison page on average frame rates, the Fury X has the upper hand here in all system configurations. Two other obvious points are noticeable here – moving from the Core i5 to the Core i7, especially on the GTX 980 Ti, makes the easy frames go quicker and the harder frames take longer, but also when we move to the Core i3, performance across the board drops like a stone, indicating a CPU limited environment. This is despite the fact that with these cards, 1280x720 at low settings is unlikely to be used anyway.


141 Comments
View All Comments
Ian Cutress - Thursday, September 24, 2015 - link
Please screenshot any issue like this you find and email it to us. :)Frenetic Pony - Thursday, September 24, 2015 - link
So interesting to note, for compute shader performance we see nvidia clearly in the lead, winning both compute and dynamic gi which here is compute based, once we get to pixel operations we see a clear lead for Amd, ala post processing, direct lighting and transparency. When we switch back to geometry, the gbuffer, Nvidia again leads. Interesting to see where each needs to catch up.NightAntilli - Thursday, September 24, 2015 - link
Once again I wish AMD CPUs were included for the performance and scaling... Both the old FX CPUs and stuff like the Athlon 860k.Oxford Guy - Friday, September 25, 2015 - link
They claimed that readers aren't interested in seeing FX benchmarked. That doesn't explain why like 8 APUs were included in the Broadwell review or whatever and not one decently-clocked FX.I also don't see why the right time to do Ashes wasn't shortly after ArsTechnica's article about it rather than giving it the GTX 960 "coming real soon" treatment.
NightAntilli - Sunday, September 27, 2015 - link
Considering that DX12 is supposed to greatly reduce CPU overhead and be able to scale well across multiple cores, this is one of the most interesting benchmarks that can be shown. But yeah. It seems like there's a political reason behind it.Iridium130m - Thursday, September 24, 2015 - link
Shut hyperthreading off and run the tests again...be curious if the scores for the 6 core chip come up any...we may be in a situation where hyperthreading provides little benefit in this use case if all the logical cores are doing the exact same processing and bottlenecking on the physical resources underneath.Osjur - Friday, September 25, 2015 - link
Dat 7970 vs 960 makes me have wtf moment.gamerk2 - Friday, September 25, 2015 - link
Boy, I'm looking at those 4k Core i3, i5, and i7 numbers, and can't help but notice they're basically identical. Looks like the reduced overhead of DX12 is really going to benefit lower-tier CPUs, especially the Core i3 lineup.ruthan - Sunday, September 27, 2015 - link
Dont worry Intel would find the way, how to cripple i3, even more.Mugur - Friday, September 25, 2015 - link
This game will be DX12 only since it's Microsoft, that's why its Windows 10 and Xbox One exclusivity.Where can I find some benchmarks with the new AMD driver and this Fable Legends?