The Toshiba Q300 SSD Review: Toshiba Becomes a Retail Brand
by Billy Tallis on February 26, 2016 8:00 AM ESTPerformance Consistency
Before we start things off, I would like to cover a quick housekeeping note. Over the winter I've made some changes to the SSD testbed and our benchmarking procedures, with the goal of streamlining the process as much as possible while still producing results that are directly comparable with our 2015 benchmark scores. Performance testing is conducted with drives in a hot-swap bay so that they can be pulled from the testbed to be securely erased and pre-filled by a separate computer. I still have to manually move the drives around between phases of our benchmark suite, but the entire process of running the tests and parsing the results to generate graphs for the review is now automated and much less error prone. The new process also keeps more of the raw data around, so in future reviews I may experiment with new ways to graph what we're measuring. The Toshiba Q300's close similarity to the OCZ Trion 100 has helped validate the new procedures.
With that out of the way, we start things off with our performance consistency test, which explores the extent to which a drive can reliably sustain performance during a long-duration random write test. Specifications for consumer drives typically list peak performance numbers only attainable in ideal conditions. The performance in a worst-case scenario can be drastically different as over the course of a long test drives can run out of spare area, have to start performing garbage collection, and sometimes even reach power or thermal limits.
In addition to an overall decline in performance, a long test can show patterns in how performance varies on shorter timescales. Some drives will exhibit very little variance in performance from second to second, while others will show massive drops in performance during each garbage collection cycle but otherwise maintain good performance, and others show constantly wide variance. If a drive periodically slows to hard drive levels of performance, it may feel slow to use even if its overall average performance is very high.
To maximally stress the drive's controller and force it to perform garbage collection and wear leveling, this test conducts 4kB random writes with a queue depth of 32. The drive is filled before the start of the test, and the test duration is one hour. Any spare area will be exhausted early in the test and by the end of the hour even the largest drives with the most overprovisioning will have reached a steady state. We use the last 400 seconds of the test to score the drive both on steady-state average writes per second and on its performance divided by the standard deviation.
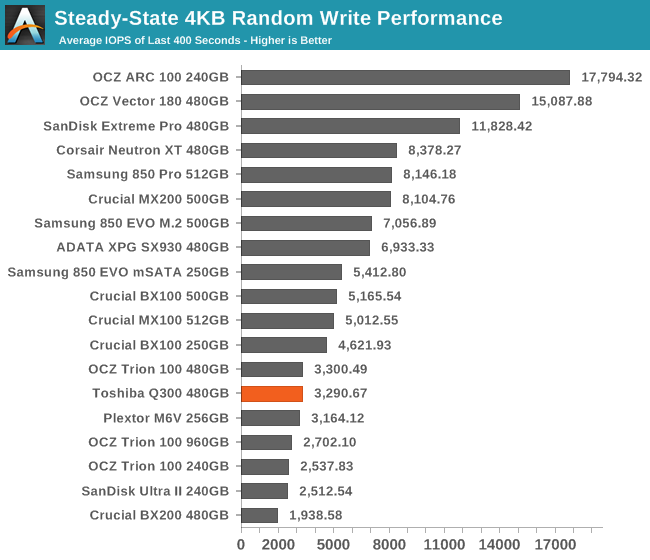
The Q300's steady-state performance is on par with the Trion 100: low, but well above the Crucial BX200 and SanDisk Ultra II. The latter drive uses SanDisk's second-generation 19nm TLC that is made on the same process as the flash in the Q300.
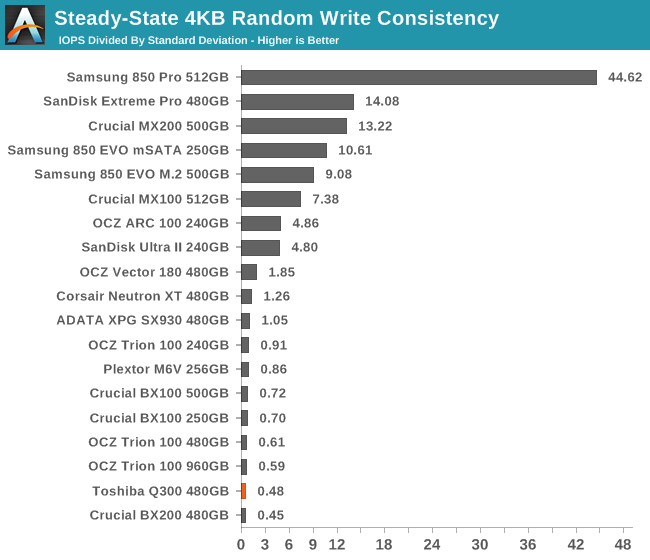
The write consistency of the Q300 is poor, but that's the case for most low-end drives - even the ones using MLC flash. As long as the performance has a reasonably high floor, a lot of variance is tolerable for client workloads. The Q300 is noticeably less consistent than the Trion 100.
 |
|||||||||
| Default | |||||||||
| 25% Over-Provisioning | |||||||||
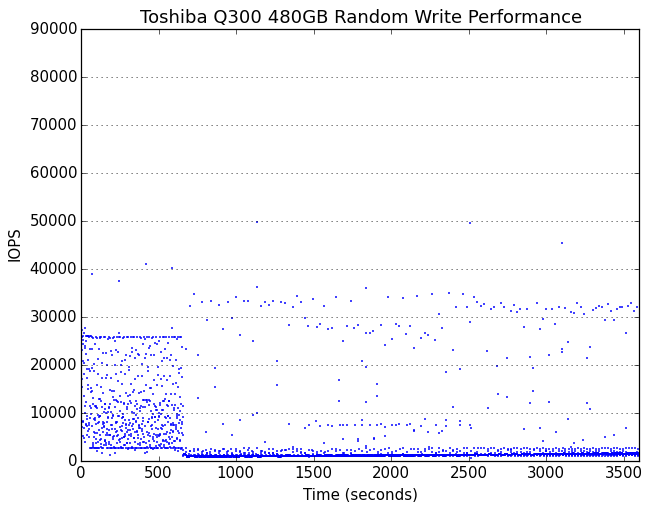
It takes about ten minutes of full-speed writing for the Q300 to burn through its spare area, which is pretty good. The steady state that it reaches is mostly consistent save for some extreme outliers.
 |
|||||||||
| Default | |||||||||
| 25% Over-Provisioning | |||||||||
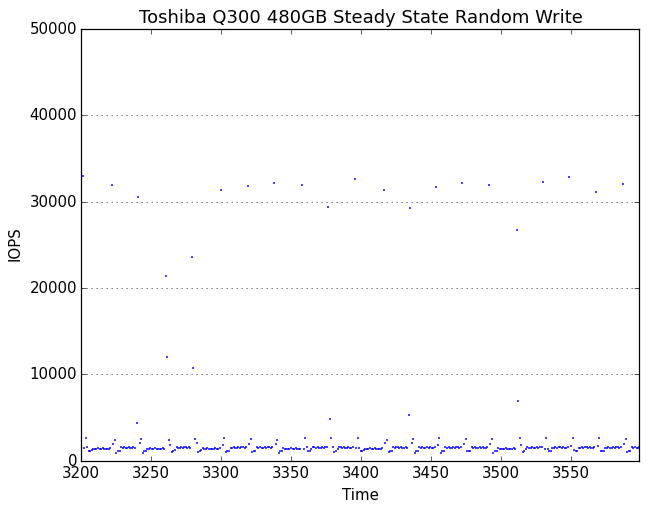
The Q300's steady-state write performance is around 1500 IOPS with several brief excursions per minute up to 30k+ IOPS. With extra space reserved, the variance increases and the steady state ranges from about 1100 IOPS to about 5500 IOPS.


30 Comments
View All Comments
bill.rookard - Friday, February 26, 2016 - link
MX100's are awesome drives, I have a pair in my webserver with a M4 for the boot drive. Sadly, the whole issue appears to be (with the exception of Samsungs drives) the TLC. When having to account for the 8 different voltage states required for 3 bit per cell it seems that the controllers are not up to the task of getting things done quickly.I'm thinking widespread adoption of V-nand (regardless of manufacturer) along with MLC in a larger lithography will wind up being the perfect storm of capacity, price, speed and endurance.
Arnulf - Friday, February 26, 2016 - link
TLC cells have 8 distinct voltage levels per cell to make up for 3 bits of information, not 3.hojnikb - Friday, February 26, 2016 - link
thats what he said.kmmatney - Friday, February 26, 2016 - link
No, he said 3, not 3vladx - Friday, February 26, 2016 - link
"No, he said 3, not 3"Huh?
boozed - Friday, February 26, 2016 - link
It's really quite simple. He said 3, not 3.extide - Friday, February 26, 2016 - link
I think what we will see is 3D TLC in pretty much all mainstream stuff, and 3D MLC in the high performance stuff.Samus - Friday, February 26, 2016 - link
It's too bad the MX100 and BX100 are harder and harder to find, when the MX200 and ESPECIALLY the BX200 are inferior.leexgx - Friday, February 26, 2016 - link
the BX100 its perfect for laptops as its super power efficient, the MX100/BX100 is the most use the most power SSD (the Adata Sp550 also uses the BX200 controller)leexgx - Friday, February 26, 2016 - link
ops!! MX200/B200 or any SSD that uses TLC with SLC cache seem to be extremely high power usage, for minimal overall speed boost (and higher chance of data loss due to SLC/TLC data movement)